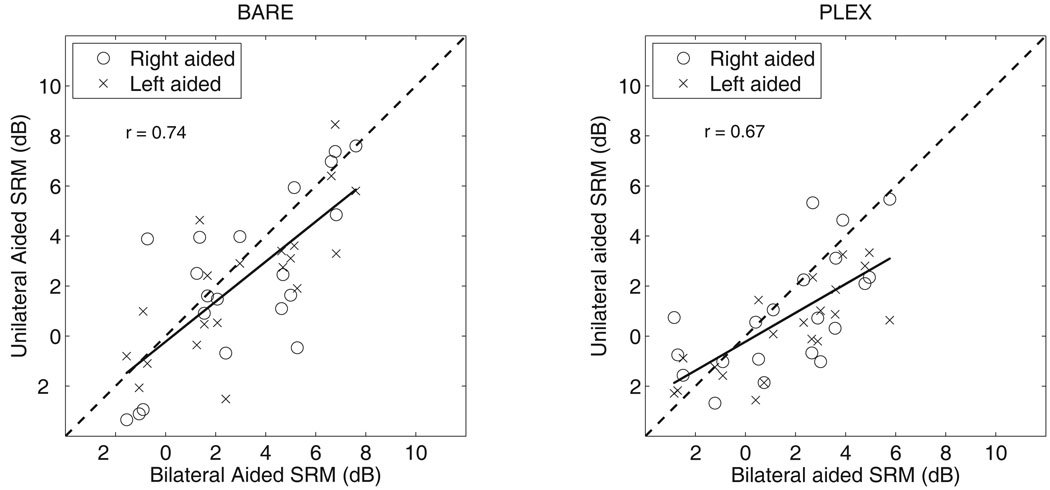
Figure 2.
The relationship between the amount of SRM in the bilateral aided condition and the amount of release in the unilateral aided conditions. The dashed line along the diagonal represents performance that is equivalent in the two conditions. The solid line represents the best-fit for the data.

