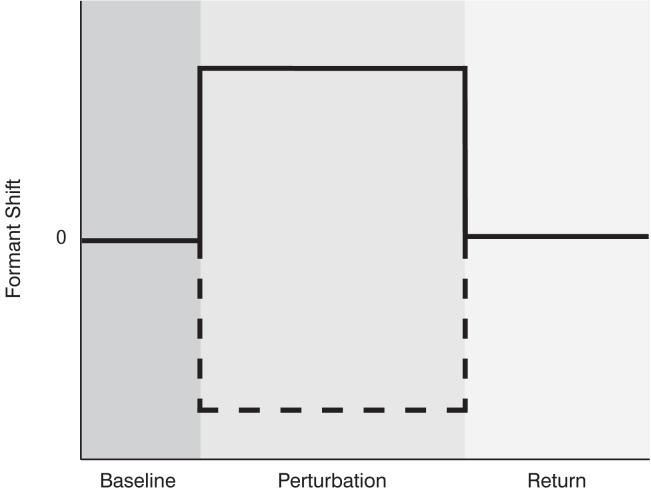
Figure 1.
Feedback shift for the three phases of the experiment. In the Baseline condition (15 utterances) the feedback was normal (unperturbed). For the Perturbed condition (40 utterances), the first formant was increased (solid line) and the second formant was decreased (dashed line). The size of the shift for each formants was calculated as the difference between the average frequency for that formant in “head” and in “had” separately for each individual. For the Return condition (40 trials), the feedback was returned to normal.

