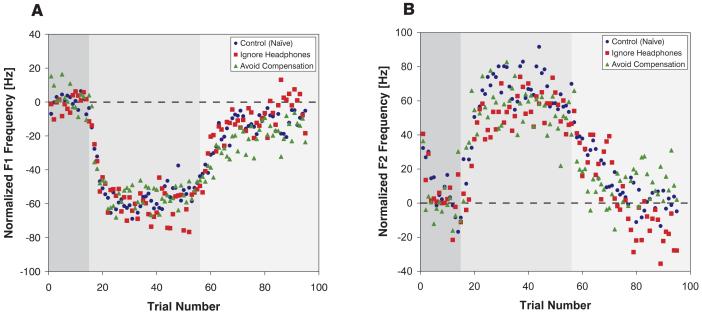
Figure 2.
Average normalized F1 and F2 frequency for each trial for the Control (circles), Ignore Headphones (squares), and Avoid Compensation (triangles) groups. Panels A and B show the results in each trial for F1 and F2 respectively. The three phases of the experiment (Baseline, Perturbed, and Return) are indicated with shading of increasing lightness.

