
Figure 3. Specific airway results for small airways.
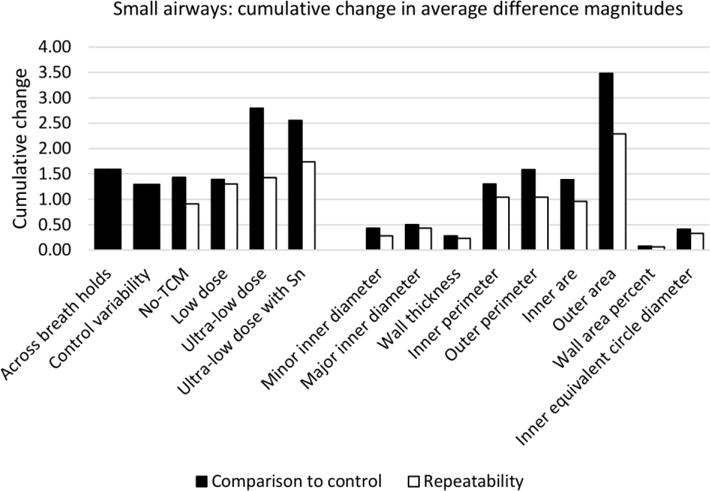
Cumulative change in average difference magnitudes for small airways showing normal variability across breath holds and within the control protocol. Results are presented with differences compared to control (black) and showing repeatability (white) and summed across measurement to assess by protocol (left) and summed across protocol to assess by measurement (left).