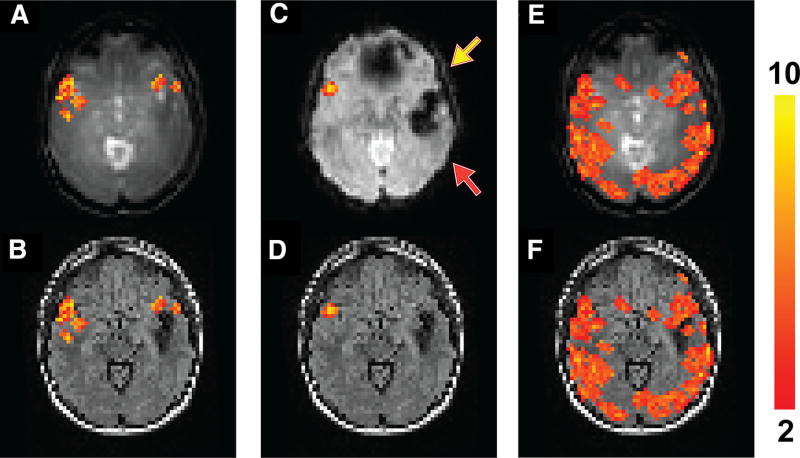
Figure 3.
Functional MRI results from patient 4 described in Table 1. Activated voxels during the sentence completion task using T2prep BOLD fMRI overlaid on the original T2prep BOLD and coregistered anatomical (FLAIR) images, respectively (A, B). Activated voxels during the sentence completion task using GRE EPI BOLD fMRI overlaid on the EPI and anatomical (FLAIR) images, respectively (C, D). Voxels with positive CVR (“activated”) during the breath-hold task using T2prep BOLD fMRI overlaid on the T2prep BOLD and anatomical (FLAIR) images, respectively (E, F). Note that the anatomical (FLAIR) images displayed here were down-sampled to match the original spatial resolution of the fMRI images. The activated voxels are highlighted with their t-scores. The scale bar on the right indicates the range of t-scores in the highlighted voxels. The yellow and red arrows point to the inferior frontal and superior temporal lobes, respectively (two important language regions in the brain).

