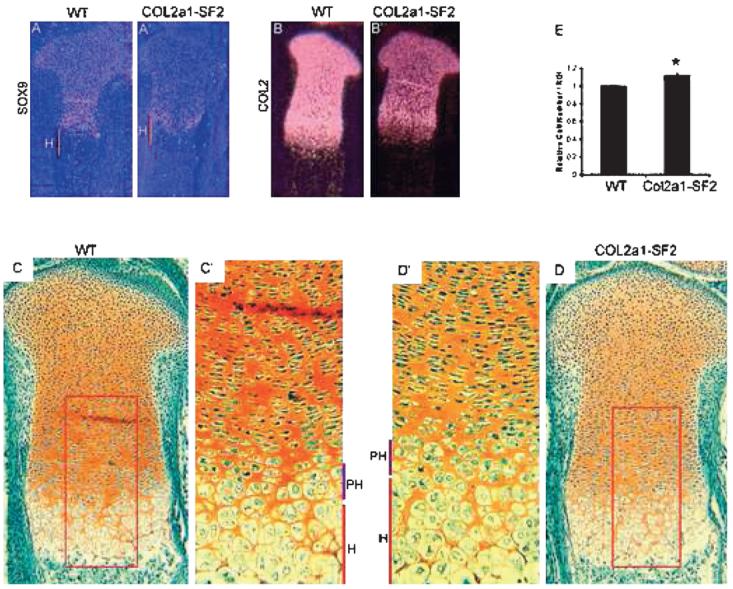
FIG. 4.

Inhibition of chondrocyte differentiation in Col2a1-Smurf2 limbs. (A–B′) Expression of chondrocyte differentiation markers Sox9 (A and A′) and Col2 (B and B′) was analyzed on sections through the tibia from wildtype (A and B) and Col2a1-Smurf2 (A′ and B′) embryos by in situ hybridization. H, hypertrophic zone (orange line). (C–D′) Safranin O staining of tibias from wildtype (C) and Col2a1-Smurf2 (D) embryos. C′ and D′ are higher-magnification images of boxed areas in C and D. PH, prehypertrophic zone (purple line); H, hypertrophic zone (red line). (E) Relative cell number per unit area of hypertrophic zone. Data are expressed as mean ± SD (n [H11505] 6). Statistical significance is assessed by an unpaired Student's t-test (p < 0.01).
