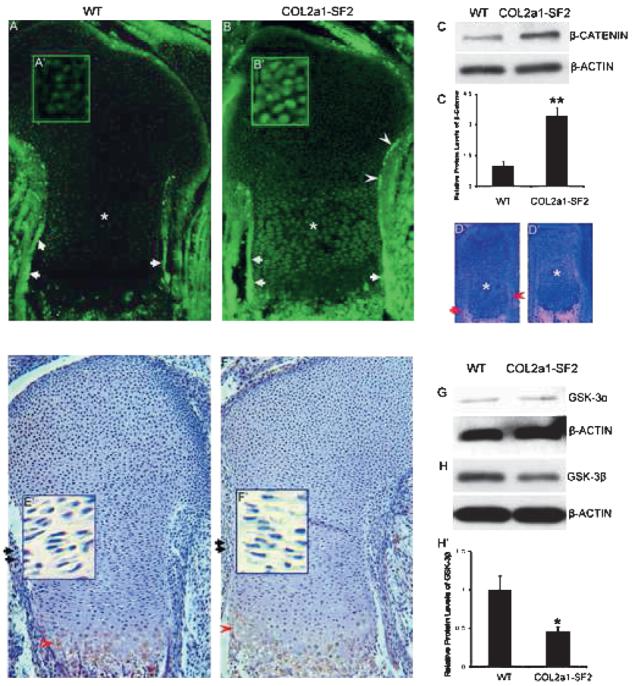
FIG. 5.

Upregulation of β-catenin protein levels in Col2a1-Smurf2 limbs. (A–C′) β-catenin protein levels were analyzed by immunofluorescence (A–B′) and Western blot (C and C′) in wildtype and Col2a1-Smurf2 limbs as indicated. A′ and B′ are higher magnification of resting chondrocytes. (D and D′) Analysis of β-catenin expression by in situ hybridization in wildtype (D) and Col2a1-Smurf2 (D′) limbs. Arrows and arrowheads indicate the perichondrium surrounding the hypertrophic and the prehypertrophic chondrocytes, respectively. Asterisks indicate the proliferating chondrocytes. (E–H′) Analysis of GSK-3β (E–F′ and H and H′) and GSK-3α (G) by immunohistochemistry (E–F′) and Western blot (G and H) in wildtype and Col2a1-Smurf2 limbs as indicated. Arrows and arrowheads indicate perichondrium and maturing chondrocytes, respectively. E′ and F′ are higher magnification of proliferating chondrocytes. The protein levels of β-catenin and GSK-3 were quantitated by scanning densitometry (normalized β-actin). Data are expressed as mean ± SD of three independent experiments. Statistical significance is assessed by an unpaired Student's t-test (**p < 0.01; *p < 0.05).
