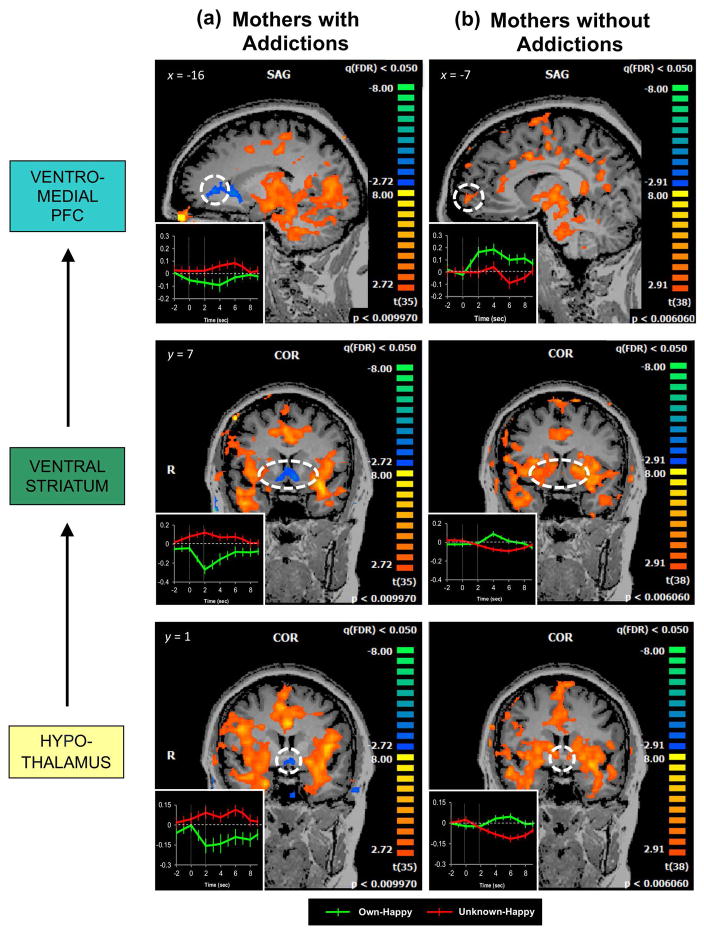
Figure 5.
Mothers with addictions (Panel A; N = 36) show decreased activation in the hypothalamus, VS, and vmPFC, which appear different from activations previously observed in mothers without addictions (Panel B; N = 39) in corresponding regions. Activation maps for mothers without addictions were generated from our previously published data (Strathearn & Kim, 2013) and are reprinted here for comparison. Both maps are thresholded at FDR-corrected q < .05. Insets of averaged hemodynamic brain responses to own-happy and unknown-happy infant faces were obtained from cubes centered at the peak voxels of each anatomical region and extending up to ± 10 voxels per dimension, unless limited by the spatial extent of activation; y axis indicates % BOLD signal change shown with standard error bars; the two vertical lines represent the onset (0 sec) and offset (2 sec) times of the infant-face-stimulus presentation. VS = ventral striatum; vmPFC = ventromedial prefrontal cortex.

