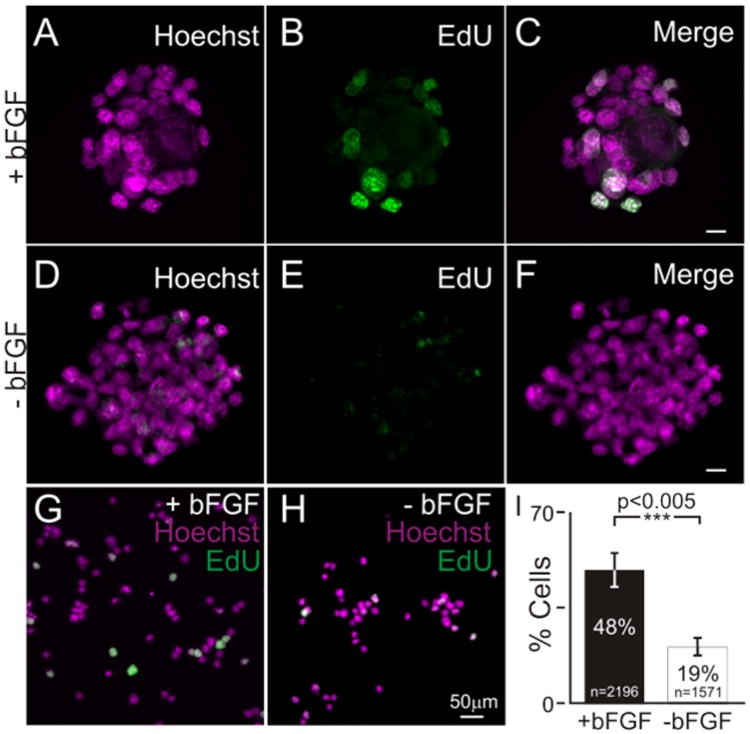
Figure 1. EdU incorporation as an assay to determine proliferative state of iMOP cultures.

iMOP-derived otospheres cultured in the presence of bFGF. Nuclei of cells were labeled with (A) Hoechst and (B) EdU Alexafluor 488. (C) Merged image of Hoechst and EdU fluorescence. Otospheres cultured 3 days in media lacking bFGF. Cells from cultures were labeled with (D) Hoechst and (E) EdU Alexafluor 488. (F) Merged images of Hoechst and EdU labeling. Merged fluorescence images of Hoechst (magenta) and EdU (green) labeled cells after dissociating otospheres and washing with 1X PBS containing 0.1% Tween 20. Cells were from otospheres cultured (G) in the presence of bFGF or (H) absence of bFGF. Length of scale bars are 10 μm unless indicated. (I) Percent of EdU labeled cells from iMOP cells cultured in the presence or absence of bFGF. The number of individual cells analyzed was denoted within the bar graph and error bars were depicted as standard error of the mean (SEM). Cell counts were from n=5 independent experiments. The Student's t-test was done to determine statistical significance.
