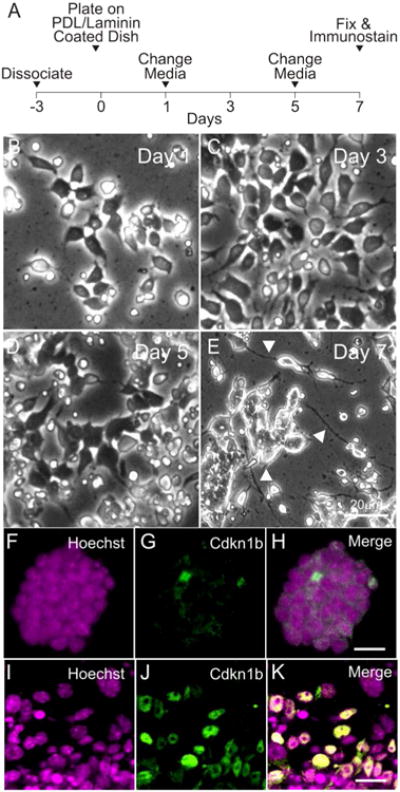
Figure 4. General schematic of neuronal differentiation.

(A) Timeline for differentiating iMOP cells into neurons. Phase contrast images of iMOP cells undergoing neuronal differentiation at (B) Day 1, (C) 3, (C) 5 and (E) 7. Fluorescence images of iMOP cells cultured as otospheres in iMOP culture media with (F) Hoechst and (G) Cdkn1b. (H) Merged image of cells labeled with Hoechst and Cdkn1b. Fluorescence images of iMOP cells 7 days after neuronal differentiation. Nuclei of cells were labeled with (I) Hoechst and (J) Cdkn1b. (K) Merged image of cells labeled with Hoechst and Cdkn1b. Length of scale bars are 10 μm unless noted.
