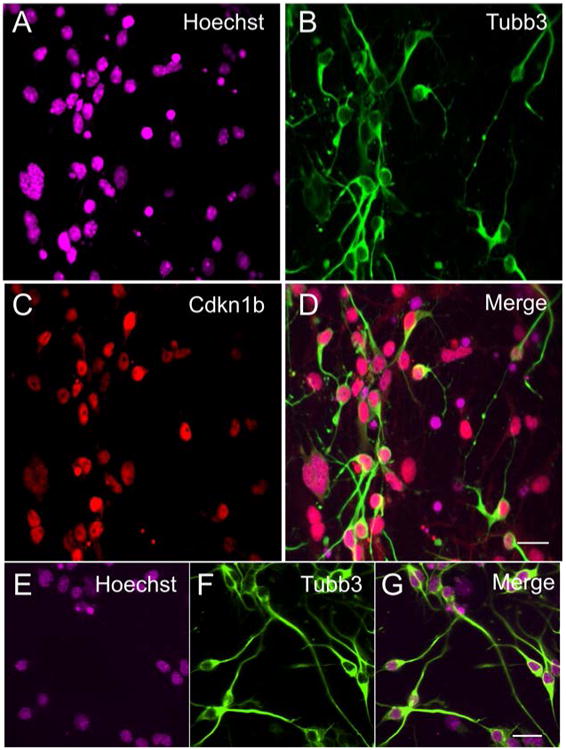
Figure 5. Expression of molecular markers indicative of cell cycle exit and neuronal differentiation.

iMOP cells 7 days after neuronal differentiation. Nuclei were labeled with (A) Hoechst and (B) Cdkn1b antibodies. The cellular morphology was highlighted with (C) Tubb3 (neuronal β-tubulin) antibodies. (D) Merged image with labeling of Cdkn1b and Tubb3 in individual cells. Magnified image of iMOP-derived neurons with nuclei labeled with (E) Hoechst and neuronal processes labeled with (F) Tubb3 antibody. (G) Merged image of bipolar or pseudo-unipolar morphology displayed by iMOP-derived neurons. Length of scale bars are 20 μm.
