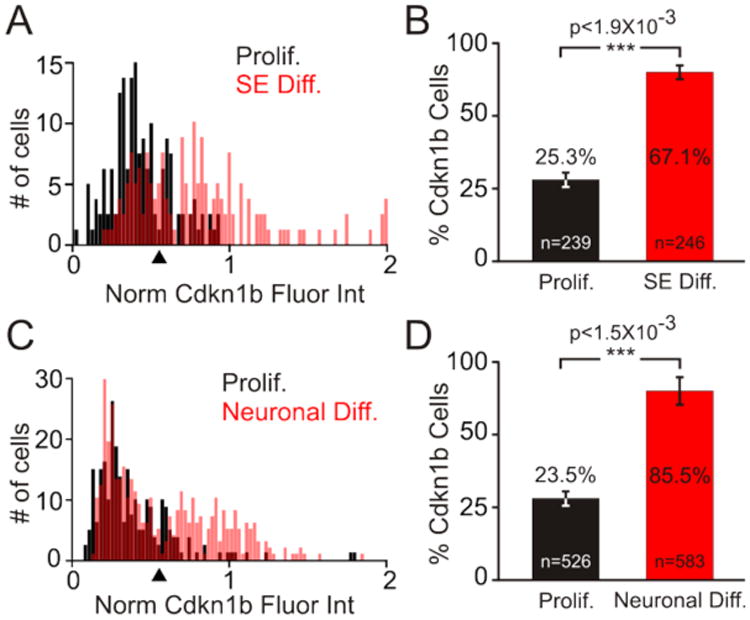
Figure 6. Single cell quantitative fluorescence intensity analysis of Cdkn1b.

(A) Normalized fluorescence intensity of Cdkn1b expression was determined by calculating the ratio of Cdkn1b and Hoechst fluorescence intensity from individual cells. The normalized fluorescence intensity was plotted relative to cell numbers as a histogram. Normalized fluorescence intensity of Cdkn1b from proliferating iMOP cells cultured in the presence of bFGF (black) and iMOP otospheres differentiated into sensory epithelia (SE) (red) are shown. A threshold was set at 0.65 normalized fluorescence intensity units (arrowhead) (B) Percentage of iMOP cells expressing Cdkn1b above the threshold value, from proliferating (black) and sensory epithelia differentiated cultures (red). (C) Normalized fluorescence intensity of Cdkn1b expression from proliferating iMOP cells (black) and neuronal differentiated iMOP cells (red) were plotted and a threshold set (arrowhead) as described above. (D) Percentage of iMOP cells expressing Cdkn1b from proliferating (black) and neuronal differentiating cultures (red). Individual cells used for analysis were denoted in each bar graph. Results were compiled from different experiments (n=3) and error bars depicted as SEM. The Student t-test was used to determine the statistical significance.
