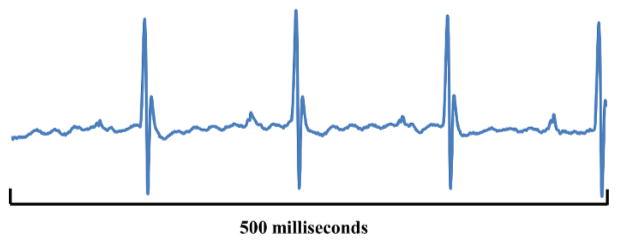
Figure 7. Graphed mV Values.
The graph displayed in this figure shows mV values from three consecutive and complete waveforms using the physiological data file (Figure 6). The graph is a simple line graph using points from the physiological data file. Please click here to view a larger version of this figure.

