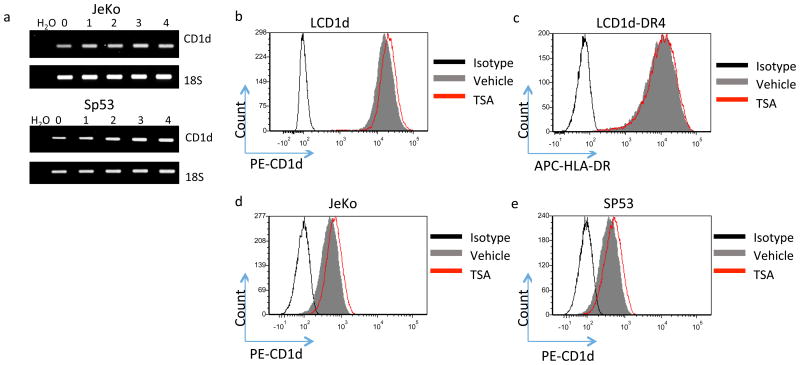
Figure 2. HDAC inhibitor treatment rapidly induces CD1d mRNA and protein.
a JeKo-1 cells were treated with 1 μM TSA for 0, 1, 2, 3, and 4 hours and CD1d mRNA levels were assessed by RT-PCR. 18S serves as the loading control. Fold change in CD1D mRNA is calculated as CD1D/18S. The lower panel shows a graphical representation of CD1D/18S fold change vs time. The data are representative of three independent experiments. b LCD1d were treated with 1 μM TSA for 4 hours and cell surface expression of CD1d was assessed by flow cytometry. Vehicle-treated cells are represented by the shaded grey histogram. TSA-treated cells are represented by the red histogram. c LCD1d-DR4 were treated with 1 μM TSA for 4 hours and cell surface expression of MHC class II was determined by flow cytometry. d and e CD1D cell surface levels of vehicle and TSA-treated JeKo-1 (d) and SP53 (e) were assessed by flow cytometry. Geometric means (GM) were calculated and are representative of the changes seen in three independent experiments.

