
Figure 5. NELF depletion in HSPCs promotes granulocytic differentiation.
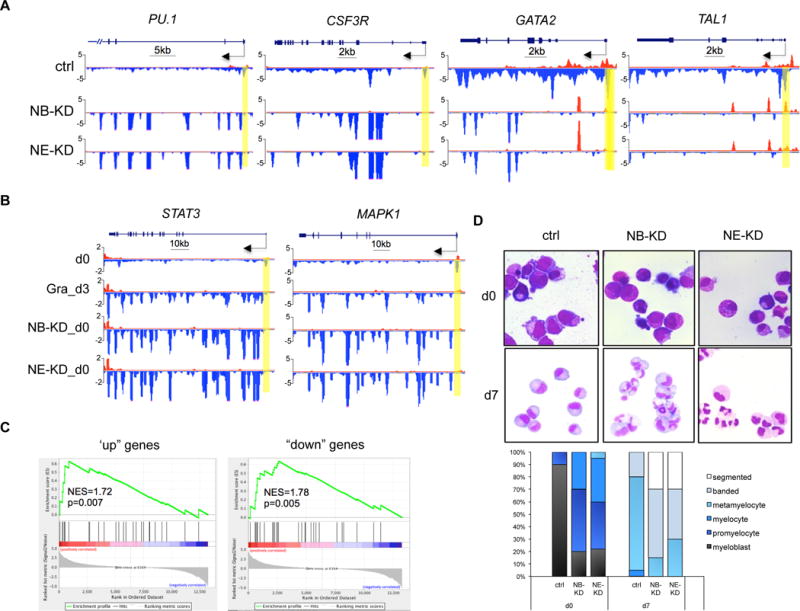
(A) Genome browser captures of GRO-seq for granulocytic differentiation regulator genes (PU.1 and CSF3R) and progenitor genes (TAL1 and GATA2) in NELF-depleted HSPCs. Scale bar and gene diagram are depicted above the captures. Yellow shades highlight promoter peaks.
(B) Genome browser captures of GRO-seq for STAT3 and MAPK1 to compare transcription activity among HSPCs (d0), 3-day differentiated granulocytes (Gra_d3) and NELF-depleted HSPCs (NB-KD_d0 and NE-KD_d0).
(C) GSEA plots to compare differentially regulated genes between NELF-depleted HSPCs and 3-day differentiated granulocytes. Genes upregulated (left) or downregulated (right) in NELF-depleted HSPCs are indicated as black bars in the middle. A strong bias for these genes to also be upregulated (left) or downregulated (right) upon granulocytic differentiation is reflected in the top plots. NES: normalized enrichment score.
(F) MGG staining to compare cell morphology between control cells (ctrl) and NELF knockdown cells during granulocytic differentiation. The percentages of different cell types at various time points during differentiation are shown on the bar charts. Quantitative results represent average percentages by counting 100 cells per experiment from 3 independent experiments.