
Figure 4.
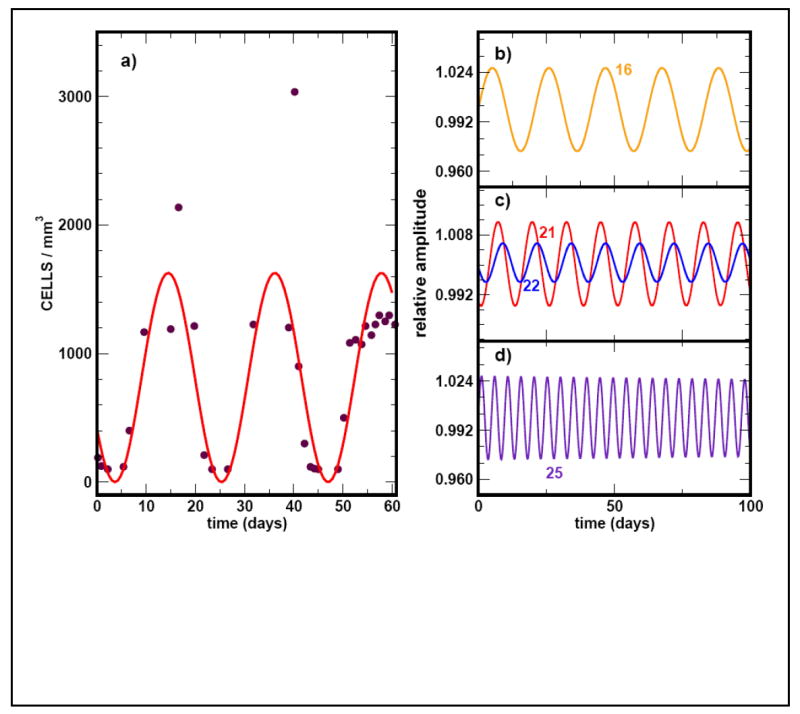
Superposition of neutrophil cycling (solid curve) as predicted by the model with experimental data taken from Hammond et al, 1989 (solid circles). The normal range for neutrophils is 1.9 − 7.0 ×10³/mm3. (A) The simulation is for a mutation that appears in compartment j = 21 with a period T = 21 days. In (B) to (D) we show simulations of the cycling frequency due to hypothetical mutations that occur in upstream (j =16) or downstream compartments (j = 25).