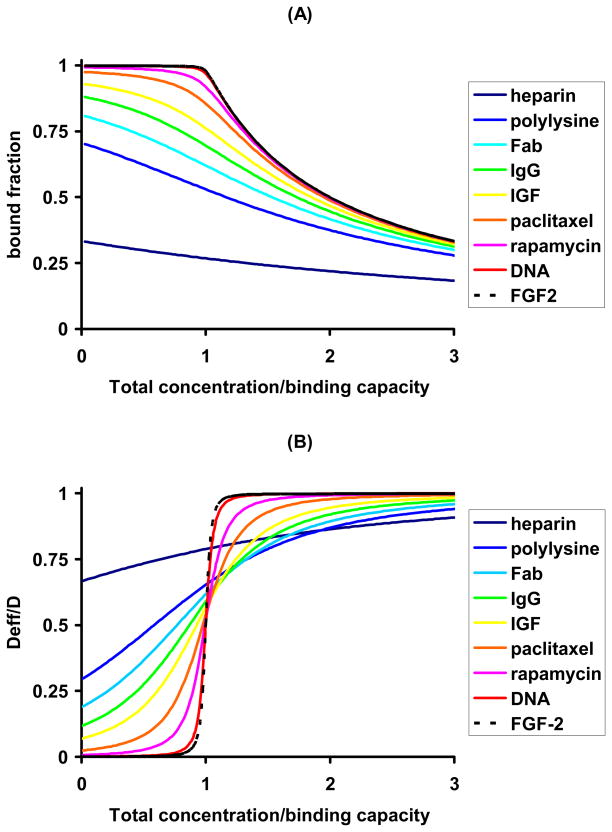
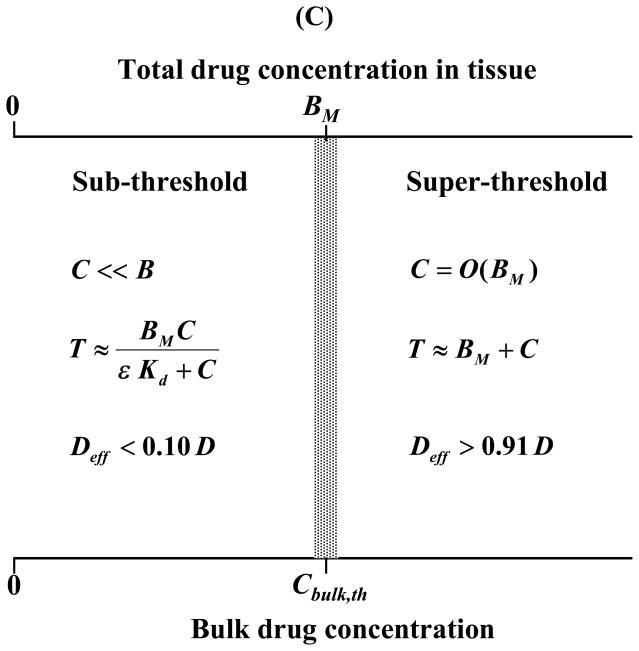
Figure 4.
Drug retention and mobility are determined by the magnitude of Bp. The fraction of bound drug (A) and the effective mobility (B) are plotted as a function of the total local drug content relative to the number of binding sites for a range of drugs and tissues (Supplemental Data). Drugs are color coded according to their Bp with cold colors (e.g. blue) designating small Bp values. Scaling analysis of the equilibrium concentration of free drug and the effective diffusivity (Appendix A) provides an estimate of the threshold bulk concentration for binding saturation and drug diffusion (C).


