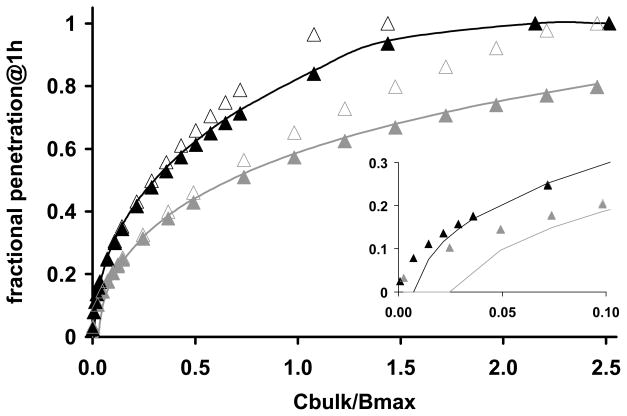
Figure 6.
Concentration dependence of drug penetration and effect. The depth at which arterial binding sites become half saturated at the end of 1h of incubation in paclitaxel (dark gray) or rapamycin (black) is plotted versus normalized bulk concentration. Numerical solutions (lines) are contrasted with S/L (solid triangles, Eqs. 23–24) or (empty triangles, Eqs. 23 and 26). Eqs. 23–24 predict the location of the binding penetration front in all but sub-saturating bulk concentrations (insert).

