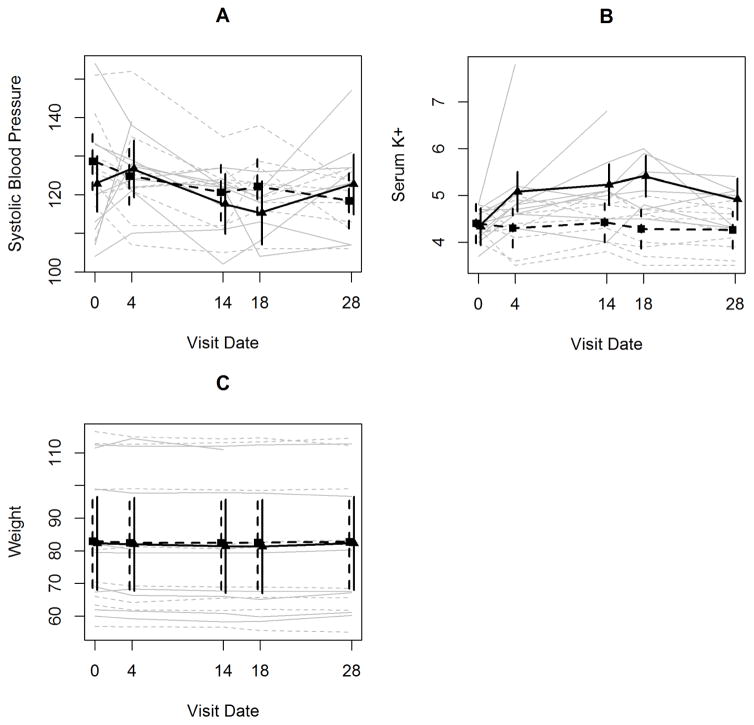
Figure 2. Trends in study outcomes over the course of the randomized trial.
Plots of observed trends in outcomes for each study participant (grey lines) and of estimated trends in means (heavy black lines). 95% confidence intervals are shown for the time-specific estimates (vertical lines). Solid lines are for results observed under treatment with amiloride and dashed lines are for results observed under treatment for HCTZ. (A) presents SBP results, (B) serum K+ results and (C) weight results

