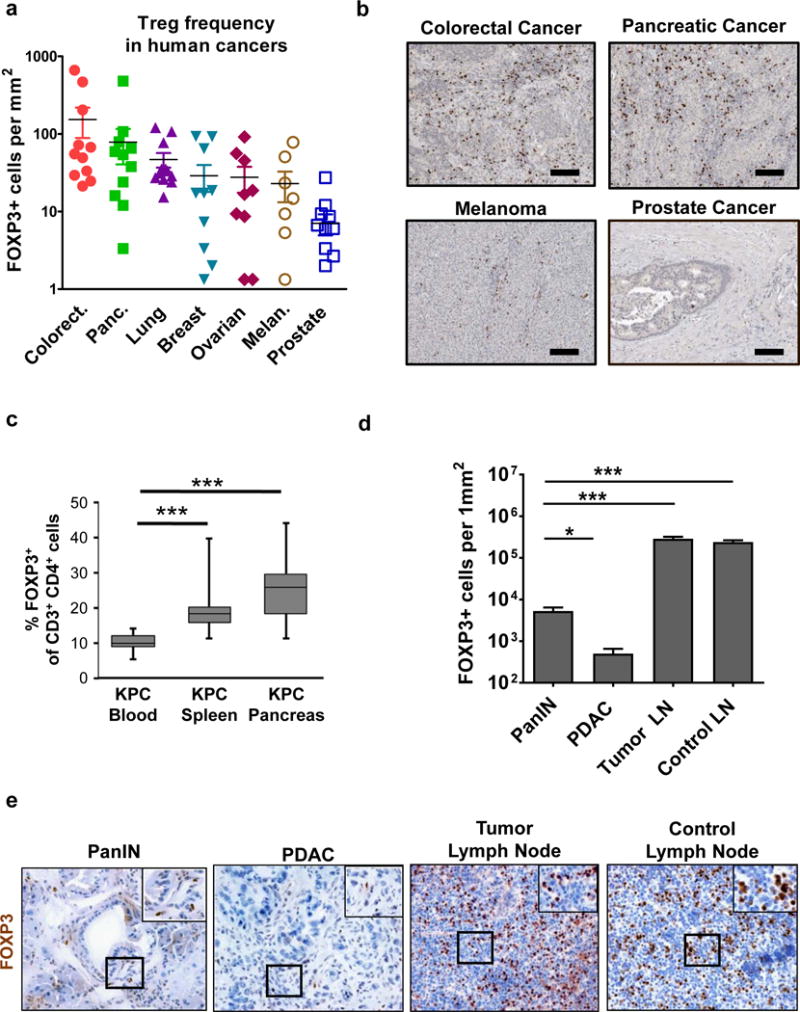
Fig. 1. Tregs accumulate in pancreatic cancer but predominately reside in peritumoral lymph nodes.

a, Foxp3+ cells were quantified in primary tumor specimens available from Human Protein Atlas database. Data points represent values from individual patients, with 8–12 patients per cancer type. b, Shown are representative images of Foxp3 staining in solid tumors available from Human Protein Atlas. Scale bar is 100 μm. c, The frequency of Foxp3+ cells in the blood (n=16), spleen (n=13) and whole pancreas (n=14), which includes peripancreatic lymph nodes and normal adjacent pancreas tissue, of KPC mice was determined by flow cytometry. Shown is d, quantification per mm2 and e, representative images of immunohistochemistry to detect Foxp3+ cells in pancreatic intraepithelial neoplasia (PanIN) (n=7), pancreatic ductal adenocarcinoma (PDAC) (n=10), peritumoral lymph nodes (n=6), and control lymph nodes (n=4) from KPC mice. Statistical significance was determined by one-way ANOVA and Tukey post-hoc test. *, p<0.05; ***, p<0.001.
