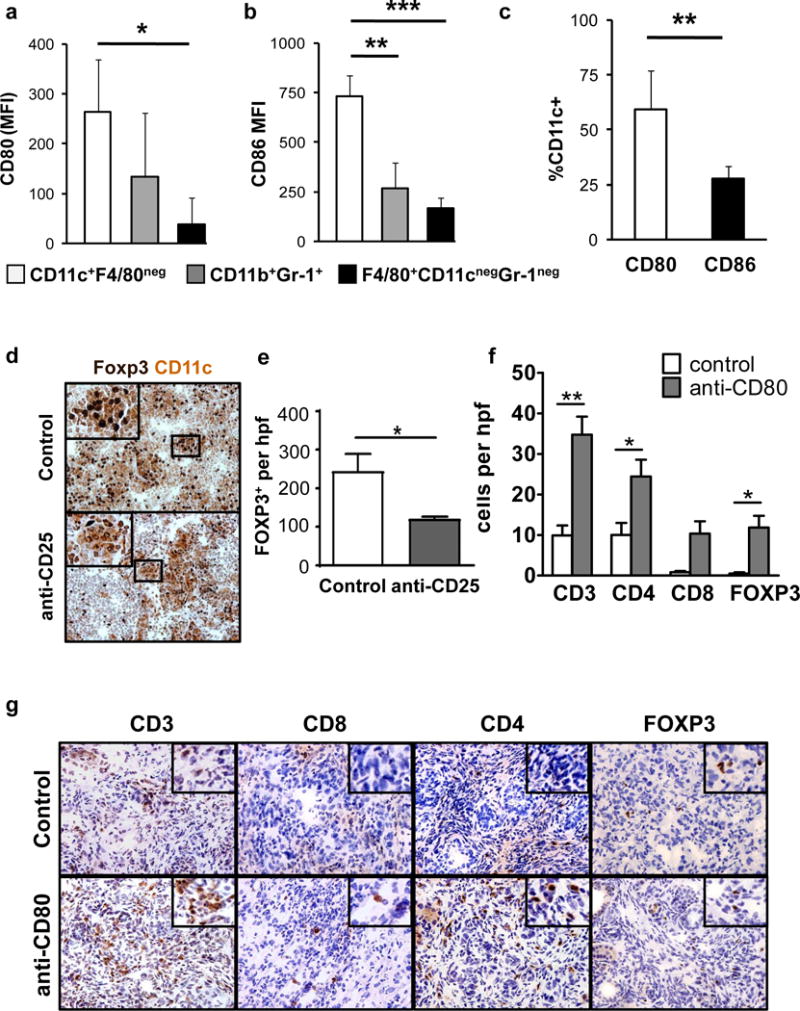
Fig. 3. T cell infiltration in PDAC is regulated by CTLA-4/CD80.

Shown is expression of a, CD80, and b, CD86 on dendritic cells (CD11c+ F4/80neg), granulocytes (CD11b+ Gr-1+), and macrophages (F4/80+ CD11cneg Gr-1neg) from peri-tumoral lymph nodes in KPC mice (n=7). c, Comparison of CD80 and CD86 expression frequency on CD11c+F4/80neg cells in the lymph node. d, Shown are representative immunohistochemistry images of peritumoral lymph nodes from KPC mice at 14+2 days after treatment with control or anti-CD25. Tissues are co-stained for CD11c (brown) and Foxp3 (black). e, Quantification of Foxp3+ Treg per high power field (hpf) in peritumoral lymph nodes of control (n=3) and anti-CD25 (n=5) antibody-treated KPC mice. f, Quantification per hpf and g, representative immunohistochemistry images of CD3, CD4, CD8 and Foxp3 cells detected in PDAC tumors from KPC mice (n=3–5 mice/group) treated with anti-CD80 antibody versus control. Statistical significance was determined by one-way ANOVA and Tukey post-hoc test. *,p<0.05; **,p<0.01; ***,p<0.001.
