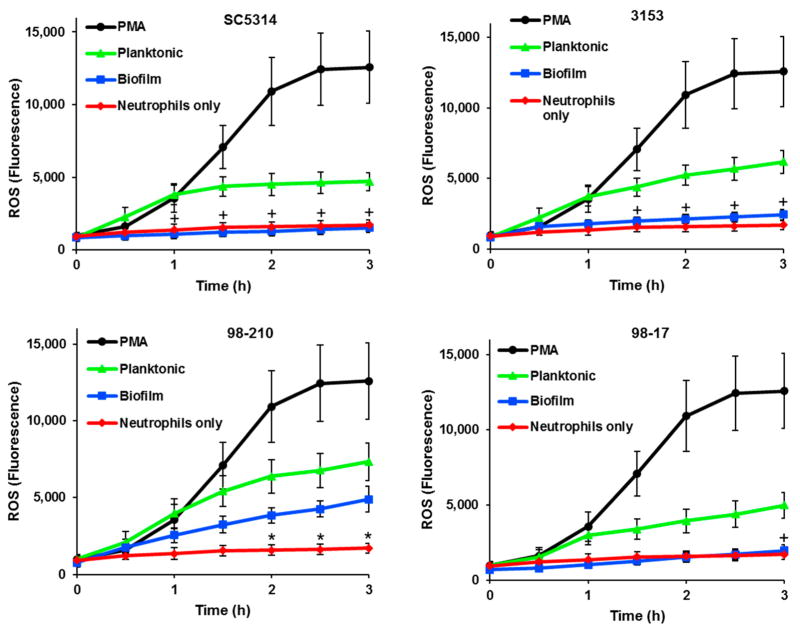
Figure 3.
ROS production by neutrophils exposed to planktonic and biofilm C. albicans. ROS generation was estimated by fluorescence after neutrophils pre-stained with CMH(2)CFDA were co-cultured with clinical isolates. ROS production by neutrophils exposed to biofilms was compared to neutrophils only or planktonic cells at each time point using a Student’s t-test, * p < 0.05 biofilm vs. neutrophils only; + p < 0.05 biofilm vs. planktonic, n = 3, SEM shown.

