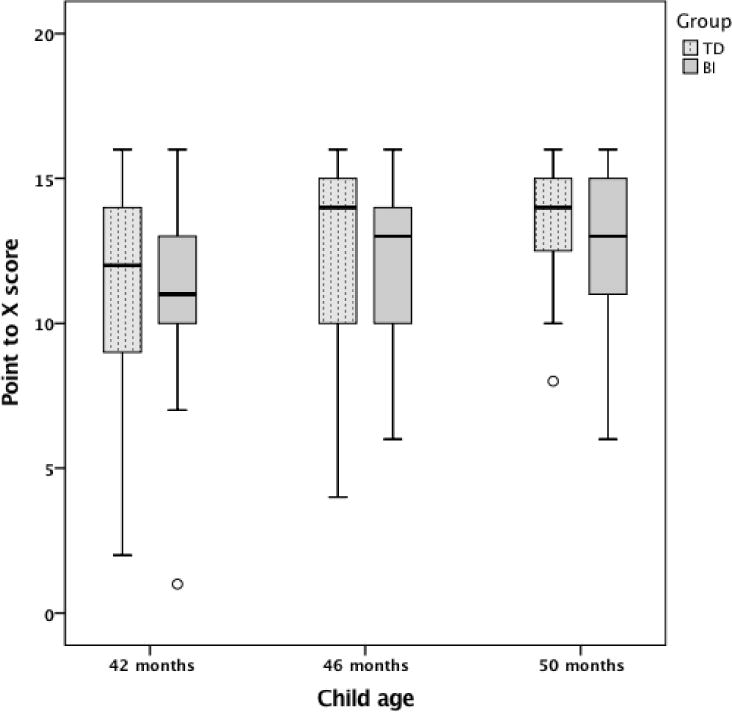
Figure 1.

Point-to-X score as a function of group (TD, BI).
Note. The bottom of the box indicates the 25th percentile and the top of the box represents the 75th percentile. Whiskers represent 1.5 times the interquartile range. Outliers are cases with values between 1.5 and 3 times the interquartile range. There were no extreme values that fell beyond 3 times the interquartile range.
