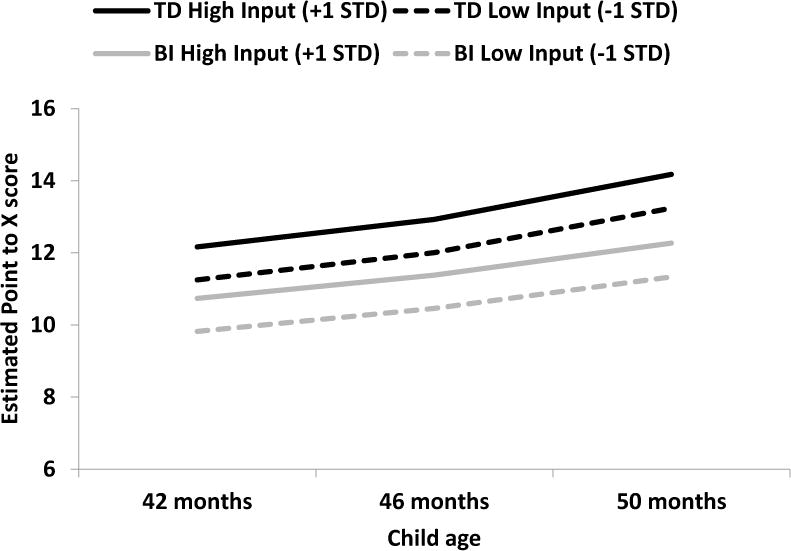
Figure 2.

Estimated growth in Point-to-X performance as a function of group (TD, BI) and parent number input (high, low).
Note. High input represents input one standard deviation above the mean and low input represents one standard deviation below the mean.
