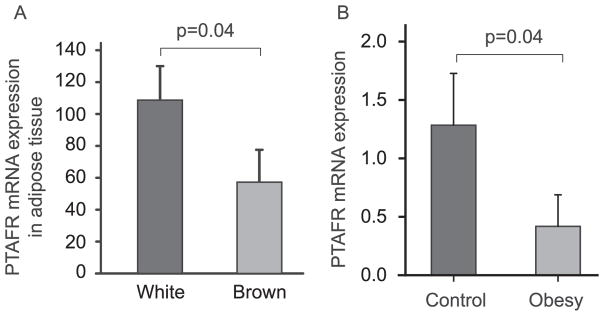
Fig. 4.
Gene Expression Omnibus (GEO) analysis of PTAFR expression. A. PTAFR expression in the white and brown adipose tissue was compared based on the data extracted from GDS2813/1427872_at/Ptafr). B. PTAFR expression in omental adipose tissue in normal and obese children was compared based on data extracted from the GDS3688/211661_x_at/PTAFR. One-tail t test were used for the analysis.

