
Figure A1.
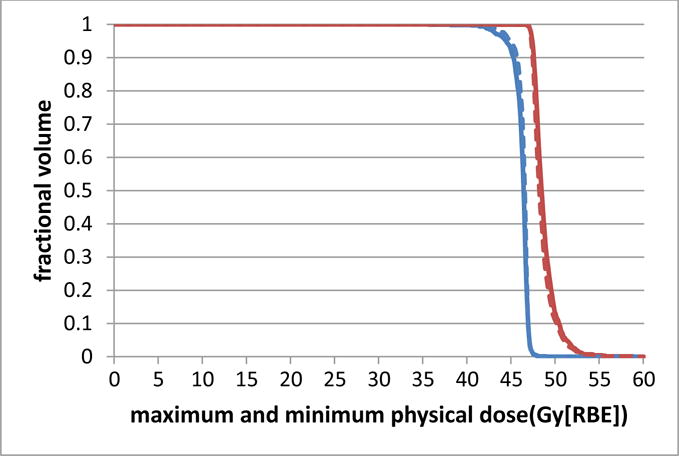
Comparison of DVH curves generated by the per-voxel maximum (red) and minimum (blue) l doses of tumor assuming a fixed RBE of 1.1 derived from the models with and without BS terms for the head-and-neck cancer case. The new model RO(BS) is represented by solid curves and the conventional model RO by dashed curves. The difference between the DVH curves generated by the per-voxel maximum and minimum doses of tumor indicates plan robustness. The difference of plan quality and plan robustness is only minor between the 2 models.