
Figure A2.
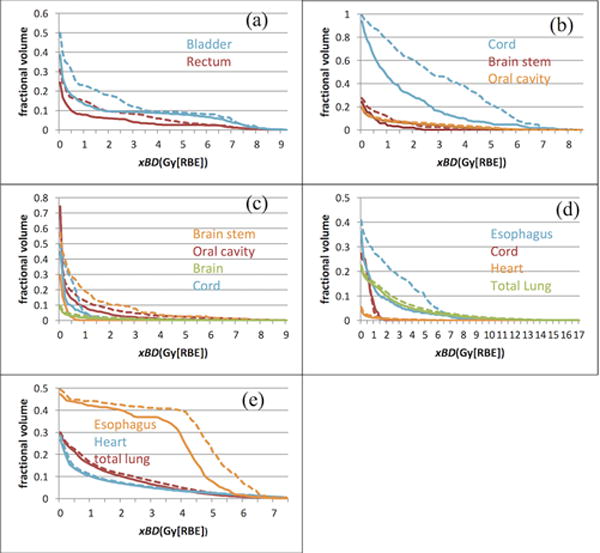
The xBD-volume histograms of the cases 1–5 (in the nominal scenario) for RO (dashed Line) and RO(BS) (solid Line), respectively. The curves from our new robust model RO(BS) were drawn as solid lines and ones from the conventional model RO as dashed lines. The RO model can reduce xBD, although the degree of reduction varies from patient to patient and organ to organ.