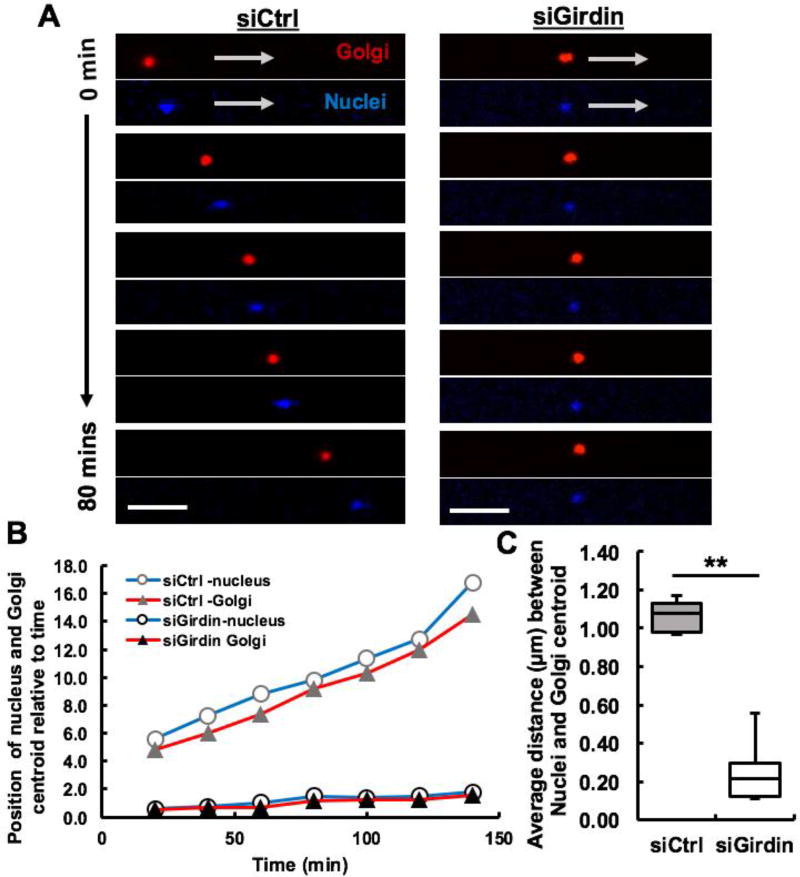
Figure 3. Girdin facilitates migration by orienting cell in the direction of migration.
(A) Time-lapse confocal fluorescence imaging of nucleus (blue) and the Golgi apparatus (red) positions of migrating single control siRNA-treated (left) and single Girdin siRNA-treated (right) MDA-MB-231 cell over a period of 80 minutes in 3D microtracks, white arrows indicating the direction of movement, scale bars 25µm; (B) Centroid positions of nucleus and the Golgi in a representable control and Girdin knockdown cell relative to time; (C) Average distance between Nuclei and Golgi centroids in control cells is greater compared to Girdin knockdown cells, # of cells per treatment=12, ** indicates p-value <0.01.

