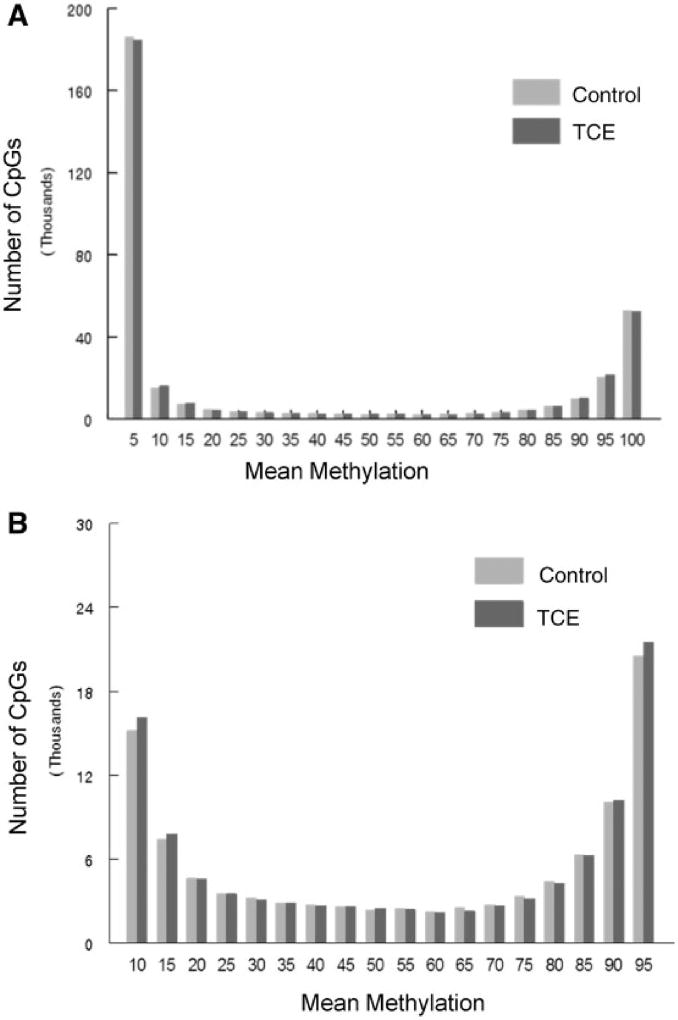
Figure 1.
Average DNA methylation levels of all CpGs interrogated. RRBS analysis of the effector/memory CD4+ T cells collected after 40 weeks of adult exposure to TCE was conducted. (A) Histograms show the average methylation of all 337 770 CpG sites examined in CD4+ T cells from either control or TCE-treated mice after binning for average methylation (e.g. 0–5% methylation or 20–25% methylation). (B) The same histograms are shown without inclusion of the CpGs that were either 0–5% or 95–100% methylated

