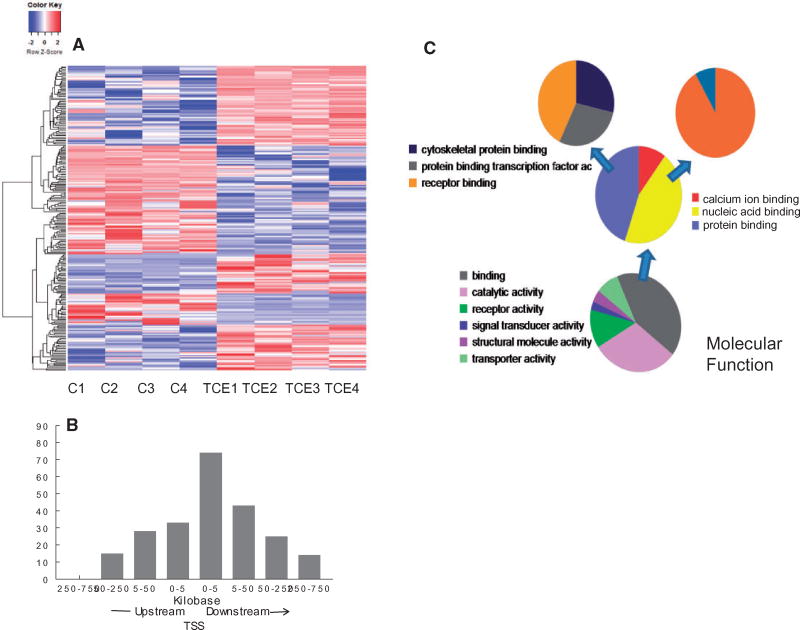
Figure 4.
Identification of CpG sites differentially methylated by TCE exposure. (A) RRBS analysis of effector/memory CD4+ T cells from control and TCE-treated mice revealed 233 DMS (methylation difference ≥ 10%, q value <0.005). Hierarchical clustering of the gene-associated DMS is shown here. (B) The genomic location of the 233 DMS detected in the effector/memory CD4+ T cells relative to the nearest transcription start site (TSS) is shown. (C) The genes associated with the DMS identified by the RRBS were subjected to a gene list functional analysis by the Panther Gene Ontology Classification System

