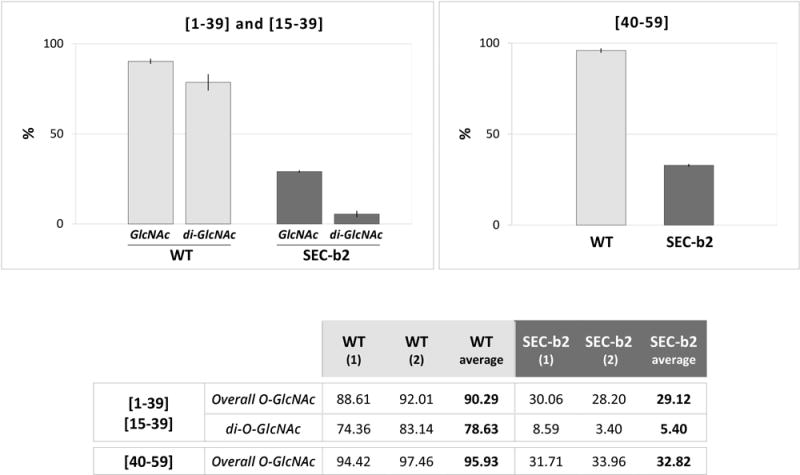
Fig. 3.

Reduction of PPV CP O-GlcNAcylation in SEC-deficient plants. Percentages were calculated as the sum of iTRAQ intensity values for the O-GlcNAcylated species (overall O-GlcNAc), or that of di-O-GlcNAcylated species (di-O-GlcNAc), each divided by the sum of the intensity values of all species of the specified peptides. The table shows values for each biological replica of PPV virions, purified from WT and SEC-b2 Nicotiana benthamiana plants, and corresponding averages. Mean values are plotted in the histograms (top) and range values are shown as vertical lines.
