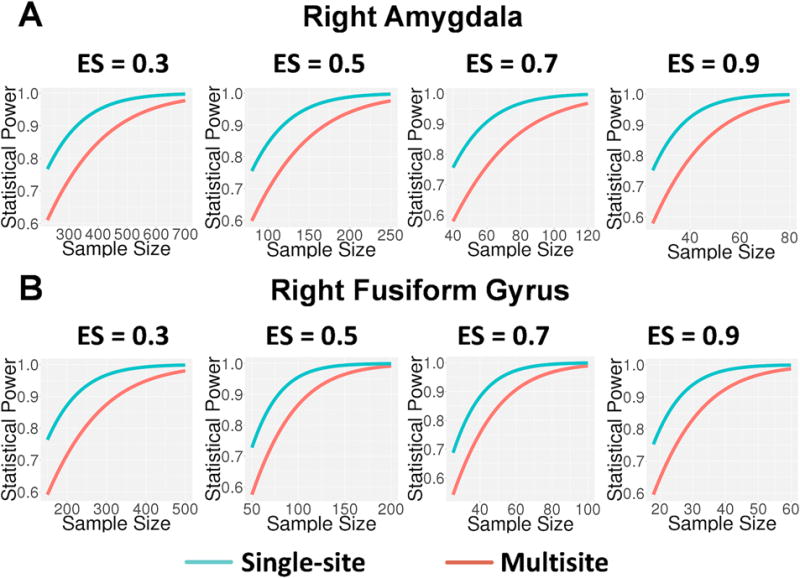
Statistical power as a function of sample size across multiple effect sizes (Cohen’s d for one group test of maximum activation in emotion matching versus shape matching contrast) for right amygdala (A) and right fusiform gyrus (B). The red lines represent power for multisite studies while the blue lines represent power for single-site studies, with nominal effect sizes adjusted downward for observed reliabilities in the multisite and single-site contexts, respectively. Although higher levels of power are achieved with smaller sample sizes in the single-site compared with multisite context, multisite studies achieve acceptable levels of power (≥ 0.8) with at least moderate effect sizes (ES ≥ 0.5) beginning at sample sizes of approximately 125 subjects for right amygdala (A) and beginning at sample sizes of approximately 85 subjects for right fusiform gyrus (B), reflecting the relatively higher cross-site measurement reliability for fusiform gyrus for this task contrast.
