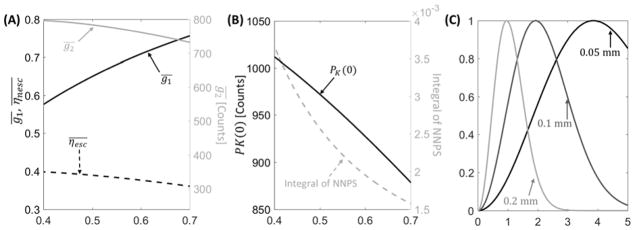
Figure 1.
(A) Quantum detection efficiency, escape efficiency (left vertical axis, black lines), and scintillator gain (right vertical axis, gray line) computed as a function of scintillator thickness. (B) Zero-frequency PK and integral of detector NNPS over the Nyquist frequency range (gray line) as a function of CsI thickness. (C) Examples of task functions (Eq. 13, assuming C=1) for three feature sizes: 0.05 mm (solid black line), 0.1 mm (solid dark gray line), and 0.2 mm (solid light gray line). The tasks emphasize distinct frequency bands depending on the underlying feature size.

