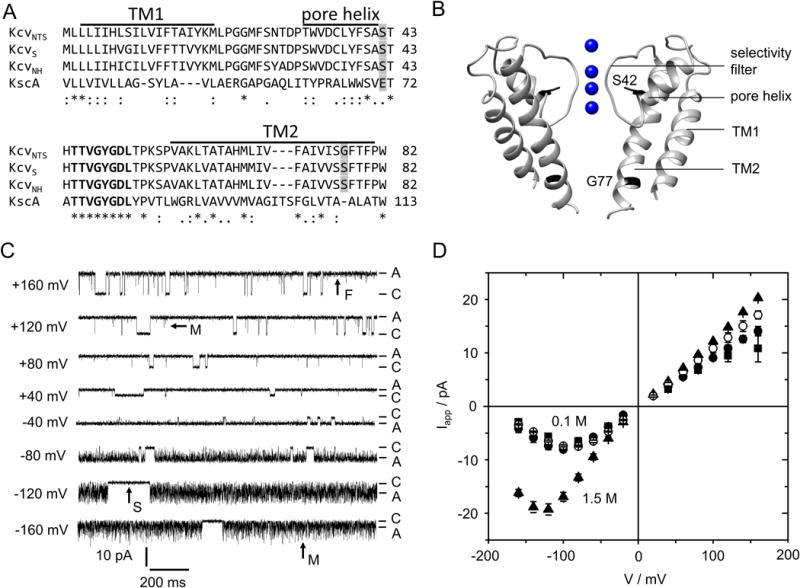
Fig. 1.

Characteristics of viral K+ channels (Kcv). (A) Alignment of 3 Kcv isoforms with KcsA. The conserved selectivity filter sequence is printed in bold, bars mark the predicted transmembrane helices (TM1, TM2) and pore helix of KcvNTS (28). Positions mutated in this study are shaded in gray. (B) Structural model of KcvNTS with those positions highlighted that were mutated in this study. The homology model was built with Swissmodel (34) after KirBac1.1 (PDB 1P7B (35)). (C) Current traces of a single in vitro expressed KcvNTS channel in a DPhPC bilayer in symmetrical 0.1 M KCl, pH 7. Membrane voltage is indicated at each trace. C and A label the closed state (baseline) and apparent open current Iapp, respectively. Examples of slow (S), medium (M) and fast (F) gating are indicated by arrows. (D) Apparent single-channel IV curves of KcvNTS (filled circles), KcvNH (squares), and KcvNH S77G (open circles) for symmetrical 0.1 M and of KcvNTS in 1.5 M (triangles) KCl. Mean of 3 experiments, 6 for KcvNTS at 0.1 M. The standard deviation is mostly smaller than the symbols.
