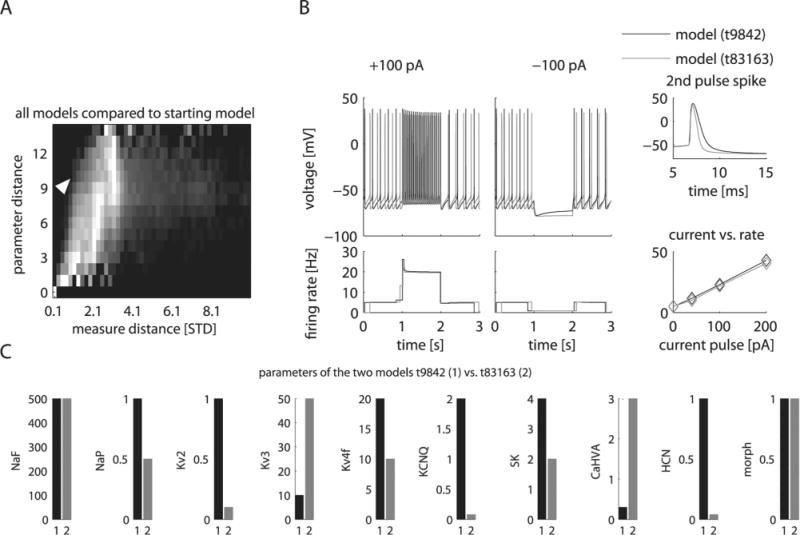
Figure 6.

Models with different channel densities could lead to similar behavior. A, The landscape of relationship between distances in model parameters and in electrophysiological properties of all models compared with the starting model showed regions where models were similar in activity but disparate in parameters. The grayscale color in this two-dimensional histogram indicated the percentage of models out of all models with a parameter distance that fall within the range of property distance denoted on the x-axis. Each row in the histogram was normalized by the bin with maximal number of models indicated with the brightest white (see supplemental Table 5, available at www.jneurosci.org as supplemental material, for the normalization coefficients). For example, there are only very few models with a very small parameter distance to the original model, and all of these show a small distance in properties (bottom left corner of plot). There are also only a small number of models with a maximal distance in parameter space, and most of these show an intermediate property distance (top row). There are many models with intermediate parameter distances, and these show a large range of property distances, among them the largest observed total property distances (middle rows). STD, Standard deviation. B, C, The baseline model is compared with the model found from the landscape in A (white arrow) with the largest discrepancy between parameter distance (10) while showing a small property distance (0.7) to the baseline model. Raw traces show the overall similarity between these two models (B). Nevertheless, eight of the nine conductance parameters are substantially different between the two models, whereas only the level of NaF and the morphology of the neuron remained the same (C).
