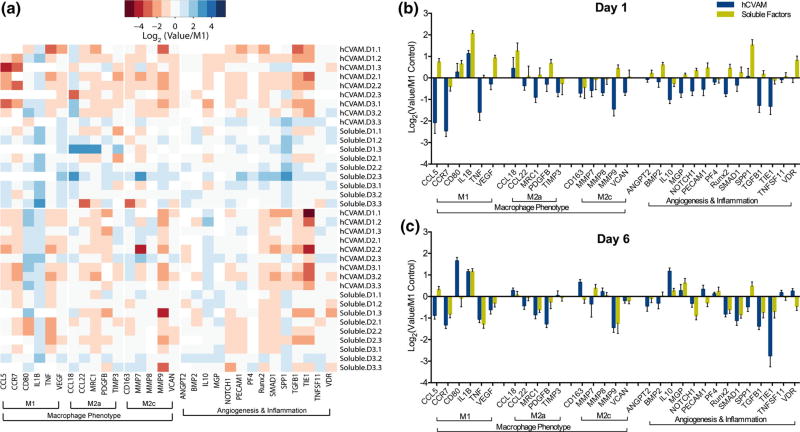
FIGURE 2.
(a) Heatmap of all gene replicates represented as Log2(value/M1 Control) generated in R using heatmap.2 function in gplots package; (b) all genes and samples from NanoString gene expression analysis represented as a grouped column graph of Log2(Value/M1 Control) for day 1 and (c) day 6. A dotted line at a fold change of 1.0 (or 0 on graphs of Log2-transformed data of values normalized to the M1 Control) represents no change vs. the M1 Control.

