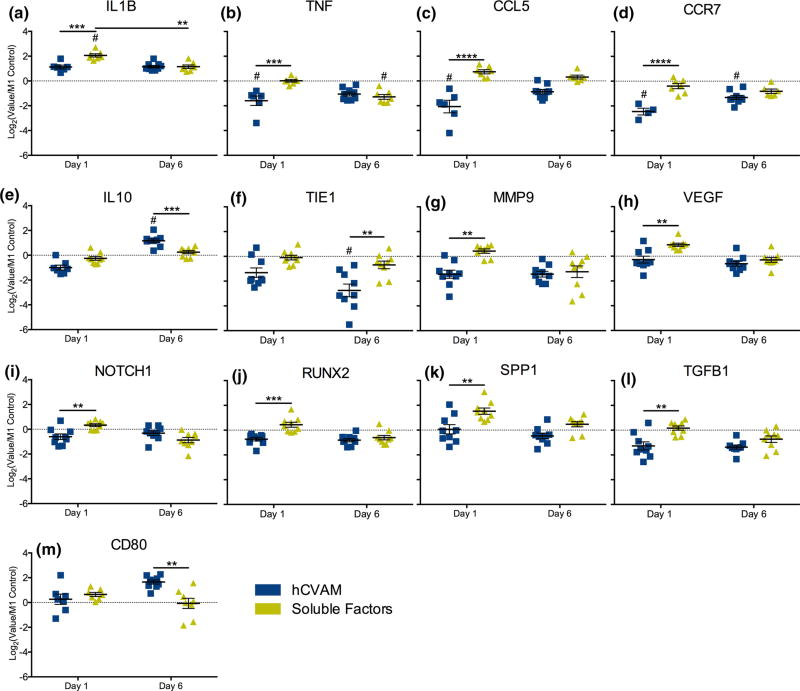
FIGURE 3.
NanoString gene expression analysis of all differentially expressed genes (p<0.01). hCVAM data are represented as Log2(Value/M1 Control) and as the mean of all experimental replicates (n = 4–9) ± standard error of the mean (SEM). A dotted line at a fold change of 1.0 (or 0 on graphs of Log2-transformed data of values normalized to the M1 Control) on each individual gene represents no change vs. the M1 Control; those samples significantly different from the M1 Control are shown with a # symbol (p<0.01). Statistical significance between treatment groups (represented with black bars) was calculated using a two-way ANOVA with a Tukey’s post hoc multiple comparisons test, *p<0.01, **p<0.001, ***p<0.0001.

