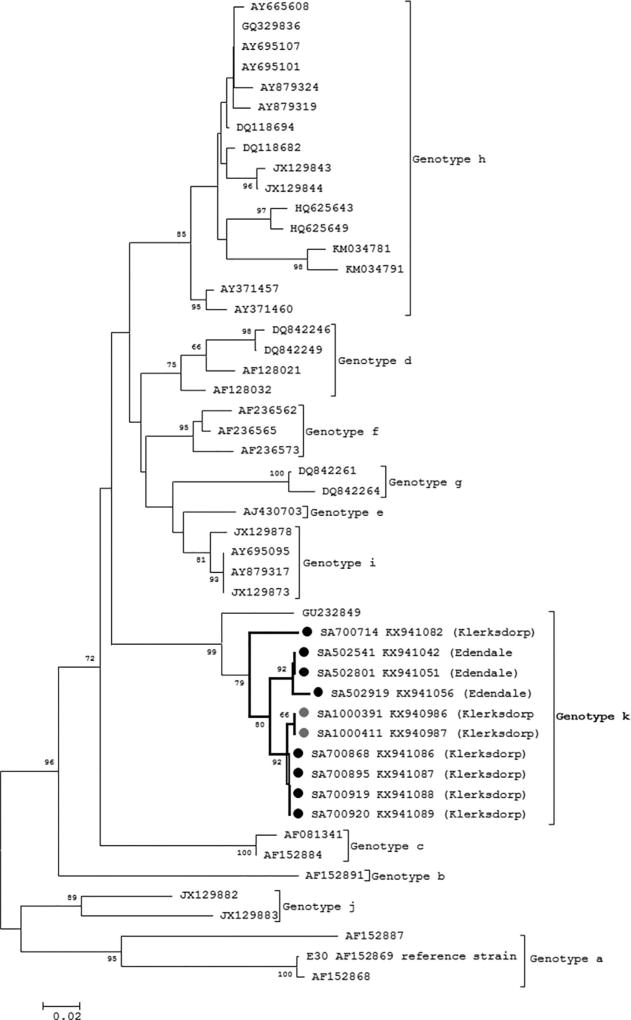
FIGURE 3.
Phylogenetic analysis of E30 serotypes by neighbor-joining phylogenetic analysis of the partial VP1 region, South Africa, 2012–2014. Sequences with black closed circles denote serotypes identified in SARI patients and those with grey closed circles denote serotypes identified in ILI patients. Bootstrap values (1000 replicates) are shown on the branches, with values <65% omitted from the tree. The scale indicates number of base substitutions per site

