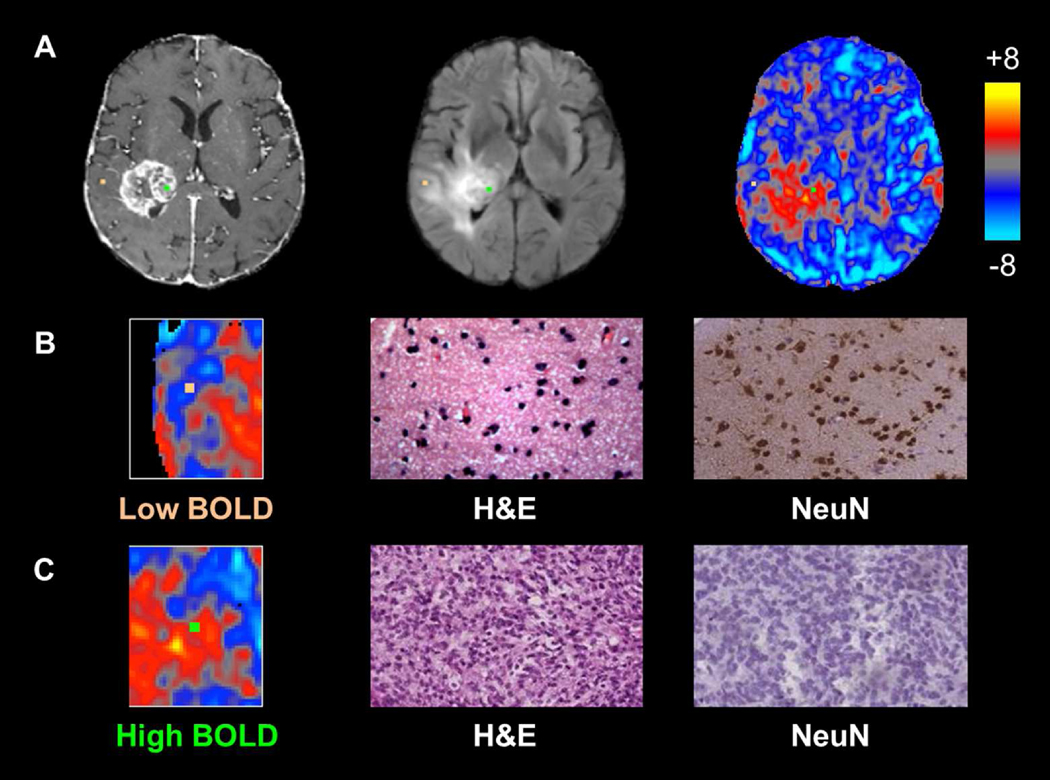
Figure 1. Individual biopsies from areas of intact and disrupted vascular function exhibit distinct histopathologic characteristics.
Panel A shows biopsy locations overlaid onto T1 post-contrast, FLAIR, and BOLD images with correlative histopathology in panels B and C. The sample from relatively normal BOLD signal, representing normal vascular function (orange, Panel B), shows normal cellularity and high NeuN staining, suggestive of non-infiltrated gray matter, whereas the sample from a region of BOLD signal abnormality (green, Panel C) shows tumor tissue and no neuronal staining.

