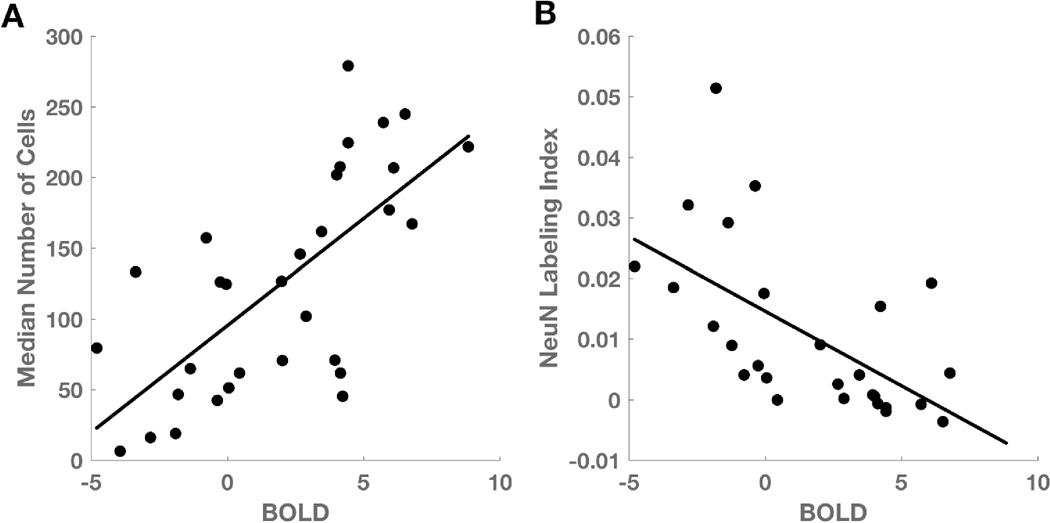
Figure 3. BOLD signal abnormality is related to total cell and neuronal density.
(A) After controlling for the effect of distance on the BOLD signal, median cell density is positively related to BOLD z-statistic (n = 31, p = 2 × 10⁻⁵). (B) NeuN labeling index is inversely related to BOLD z-statistic (n = 27, p = 0.001).

