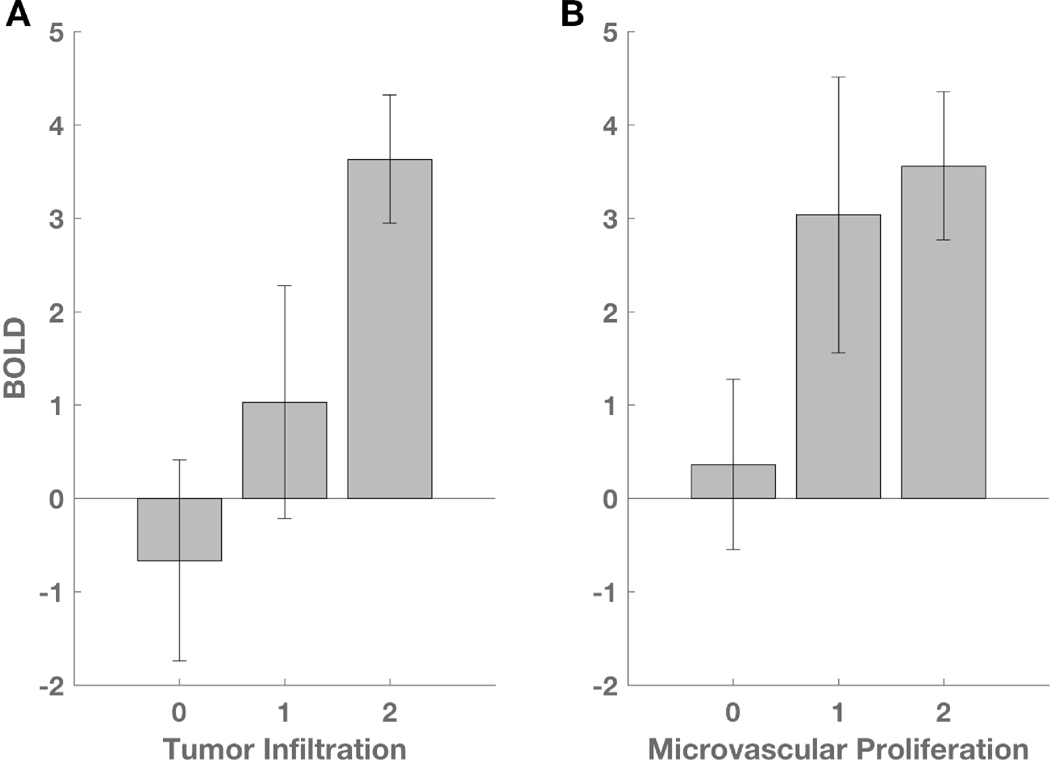
Figure 4. BOLD signal abnormality is related to tumor infiltration and microvascular proliferation.
(A) ANOVA demonstrates a significant relationship between BOLD z-statistic and tumor infiltration (p = 0.014). Scores of 0, 1, and 2, represent no detectable tumor, infiltrating tumor, and highly cellular tumor, respectively. (B) ANOVA demonstrates a significant relationship between BOLD z-statistic and microvascular proliferation (p = 0.045). Scores of 0, 1, and 2, represent normal vascular architecture, simple hyperplastic structures, and complex microvascular hyperplasia, respectively.

