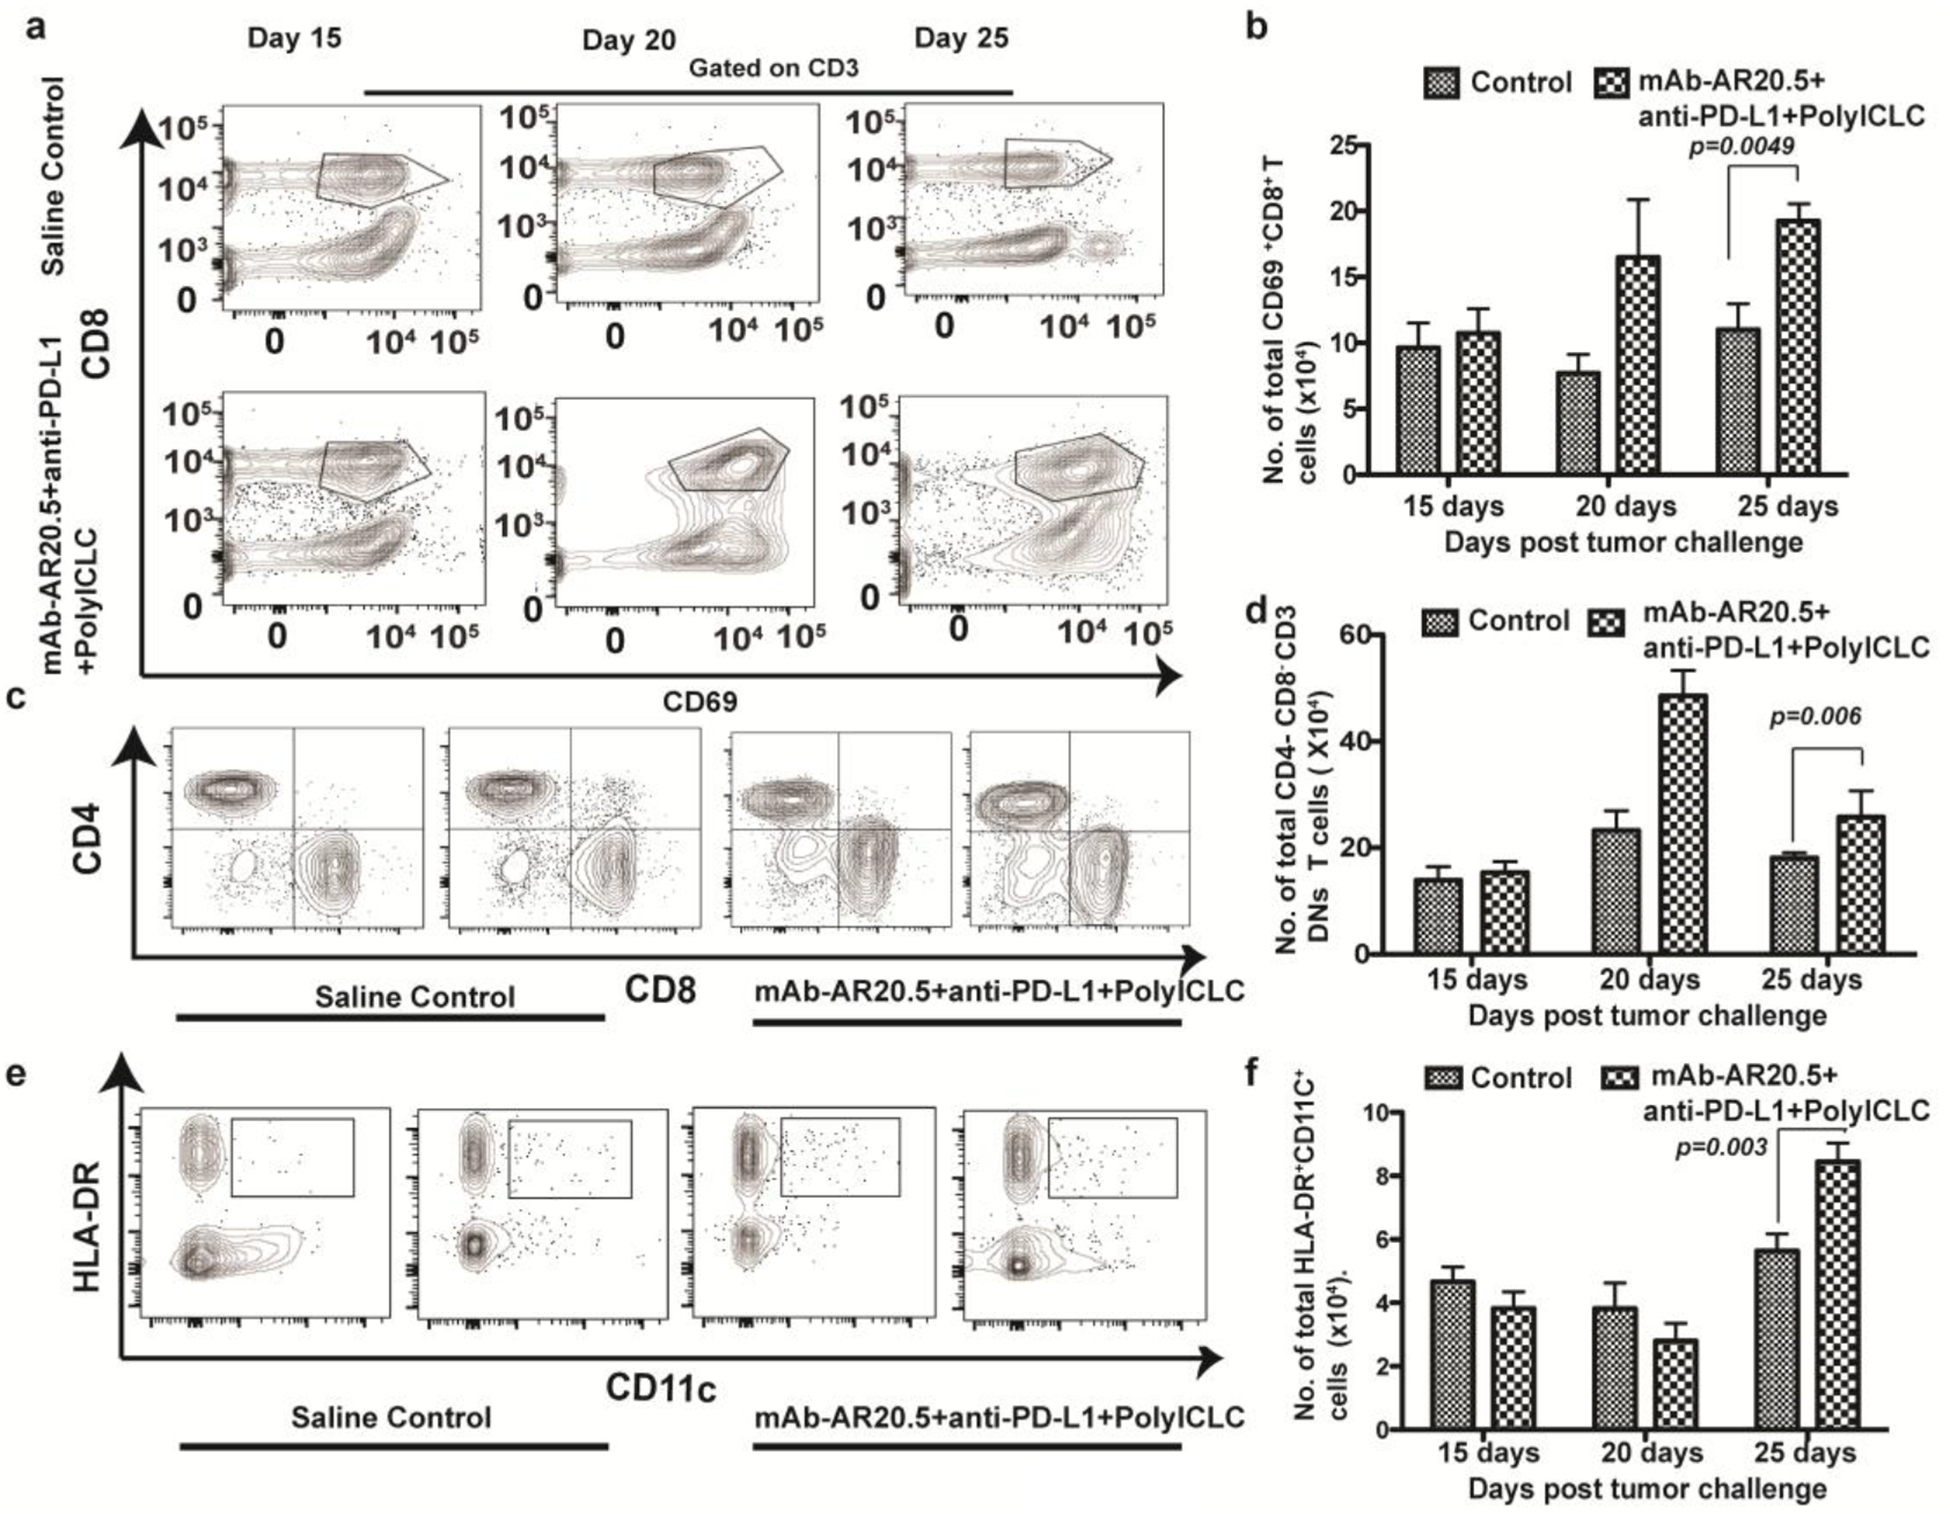
Figure 6:

mAb-AR20.5+anti-PD-L1+PolyICLC-treated mice display high numbers of circulating activated CD8, CD3+DN T cell and mature dendritic cells (CD11c+ HLA-DR+). a Representative FACS plots for activated CD8 T cells at different days post-treatment with saline or mAb-AR20.5+anti-PD-L1+PolyICLC for Panc02.MUC1 tumor-bearing mice. b Histogram plot shows the frequency of activated CD8 T cells (p=0.049) in circulation at indicated days post treatment with saline or mAb-AR20.5+anti-PD-L1+PolyICLC. c, e Representative FACS plots for CD3+DN (gated on CD3, CD69) T cells (c) and mature dendritic cells (gated on CD11b− population) (e) for two mice at day 25 in the indicated treatment groups. d, f representative histogram plot show the frequency CD3+DN T cells (p=0.006) (d), and mature dendritic cells (p=0.003) (f), in the circulation at different days post treatment with saline or mAb-AR20.5+anti-PD-L1+PolyICLC. (n=5/gp), two-way ANOVA using the Bonferroni correction for multiple comparison.
