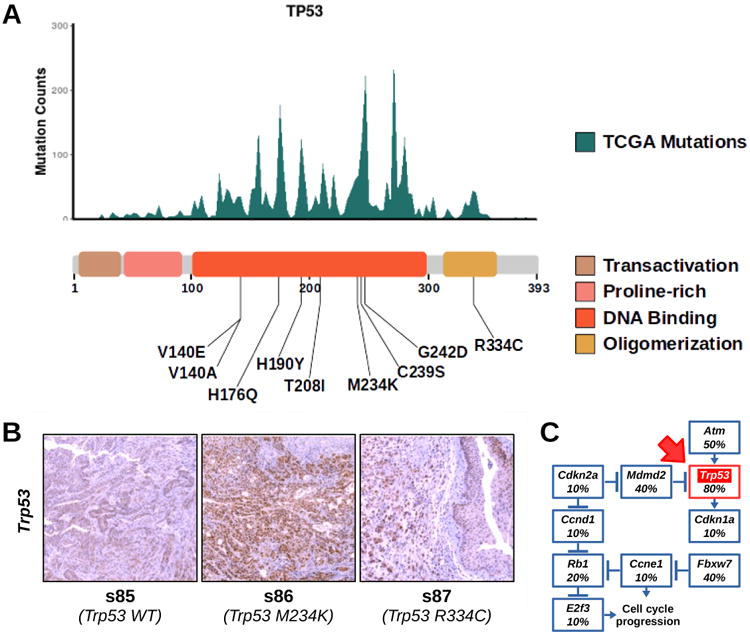
Figure 6. Trp53 Mutations in BBN tumors.

(A) Top. Histogram displaying TP53 hotspot mutations from aggregate TCGA genomes (missense, frameshift and nonsense mutations were included). Bottom. List of variants found in Trp53 mapped to a diagram of the functional domains of the protein. (B) IHC for Trp53 was performed on tissue sections from normal bladders or BBN tumors expressing wild type (left) or mutant (M234K, center; R334C, right) Trp53. (C) Diagram displaying the frequency of tumors with mutations in different genes belonging to the Trp53 pathway. Trp53 box is highlighted in red (red arrow).
