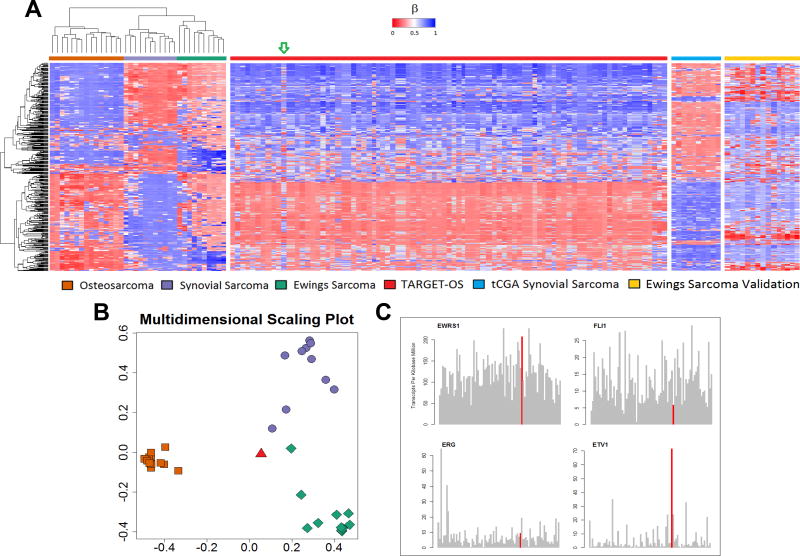
Figure 1.
(A) Unsupervised hierarchical clustering of validation and training sets shows three distinct clusters for osteosarcoma, synovial sarcoma, and Ewing’s sarcoma. The green arrow indicates the sample from the TARGET-OS dataset (TARGET-40-PASEFS) that demonstrated hypermethylation in several CpG islands uncharacteristic of other osteosarcomas. (B) Multidimensional scaling plot of random forest classifier samples demonstrates this TARGET-OS sample (red triangle) was classified as Ewing’s sarcoma. (C) RNAseq analysis of the sample TARGET-OS sample identified as EWS by methylation classifier. The TARGET-40-PASEFS sample shows overexpression of EWSR1 and ETV1. Other common fusion partners of EWSR1 including FLI1 and ERG, do not show increased transcription. Transcripts of interest are highlighted in red. RNA expression data are consistent with methylation sarcoma classifier diagnosis of EWS.

