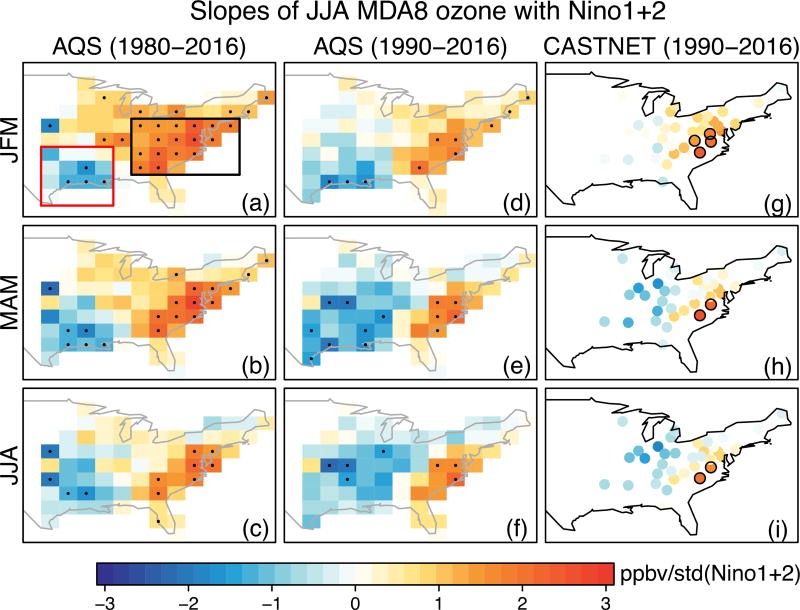
Figure 2.
Slope of JJA AQS ozone with standardized Niño 1+2 index in (a) Jan-Feb-Mar, (b) Mar-Apr-May and (c) Jun-Jul-Aug for 1980–2016. (d–f) Same as (a–c), but for the 1990–2016 timeframe. (g–i) Same as (d–f), but using the ozone observations in CASTNET. All data are detrended by subtracting the 7-year moving averages. Grid boxes with statistically significant correlations (p <= 0.1) are stippled in (a–f) or circled in (g–i). The black and red rectangles in (a) are used to define the ozone dipole pattern as discussed in Figure S4.

