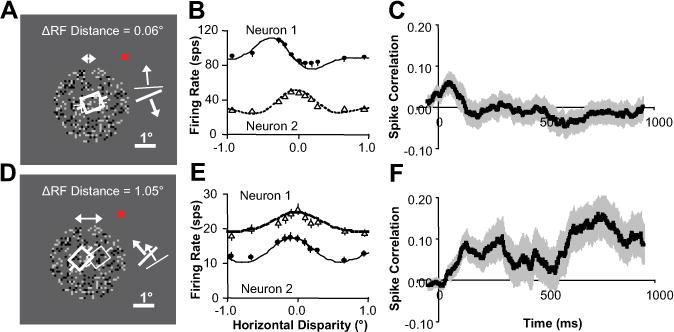
Figure 3.

Evidence of competitive and cooperative interaction. A, Neurons with overlapping receptive fields that were presented random dot stereograms (only the image for one eye is shown). The white squares and bars are preferred orientation and direction of motion. The red square is fixation point. B, Disparity tuning for neurons in A. C, Correlation versus time (100 ms sliding windows) for same data shown in B (averaged over all disparities). D, Neurons with neighboring receptive fields. E, Disparity tuning for neurons in D. F, Correlation versus time for same data shown in E (averaged over all disparities). All error bars are trial-to-trial SE (n = 60).
