
Figure 8.
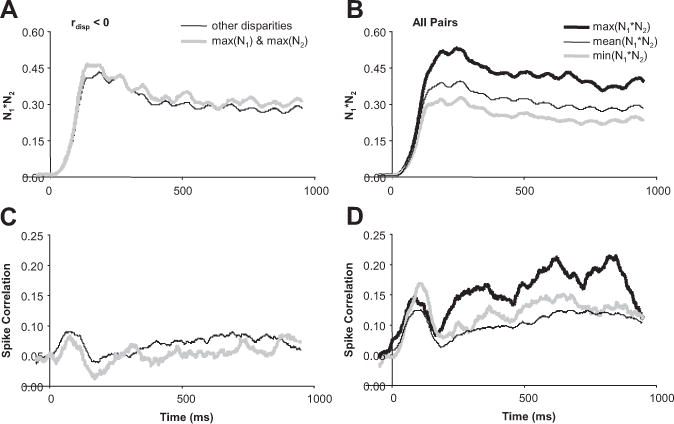
Timing of spike correlation depended on the disparity presented. A, Population average (n = 17 pairs) of N1*N2 versus time for the maximum of N1 and N2 and all other disparities. B, Population average (n = 63 pairs) of maximum, mean, and minimum N1*N2 versus time. C, Population average of spike correlation versus time for the corresponding data presented in A. D, Population average of spike correlation versus time for the corresponding data presented in B.