
Figure 5.
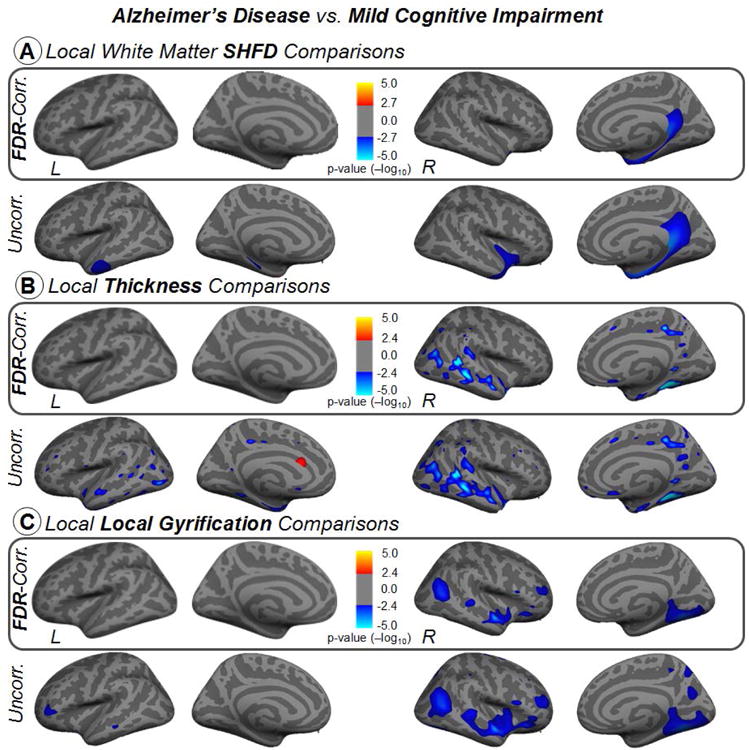
Vertex-wise comparisons of white matter SHFD, thickness and local gyrification index between Alzheimer's disease and mild cognitive impairment groups in inflated surface. Statistical analysis was controlled for age. Results were corrected for multiple comparisons using false discovery rating with q rate of 0.05. Uncorrected results are also displayed in the second row for reference purposes. The color bars show the logarithmic scale of p-values (-log10).