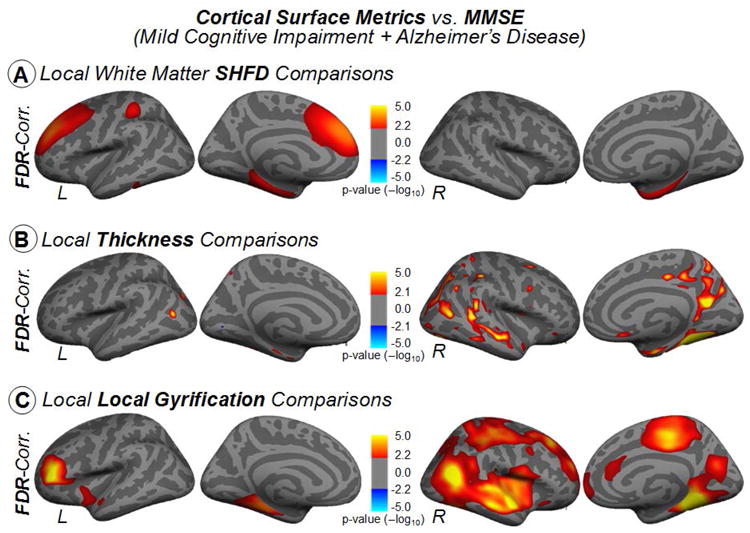
Figure 7.

Vertex-wise partial correlations, with age as nuisance covariate, between cortical measures and MMSE for AD plus MCI. Results were corrected for multiple comparisons using false discovery rating with q rate of 0.05. The color bars show the logarithmic scale of p-values (-log10).
