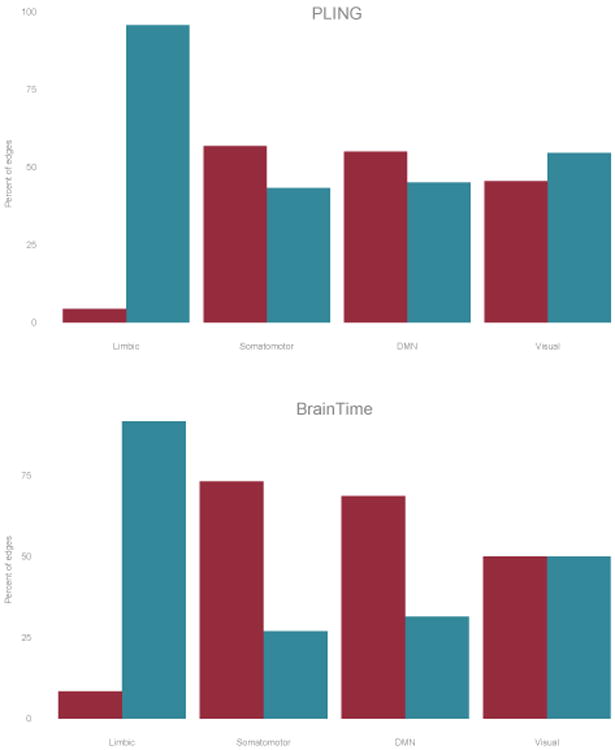
Figure 4.

Sub-networks fort the PLING (top) and BrainTime (bottom) datasets showing percentage of edges showing large change (red) and small changes(blue) in FA connecting to nodes in one of the following sub-network: cortical limbic network; somato-motor network; default mode network and visual network (left to right).
